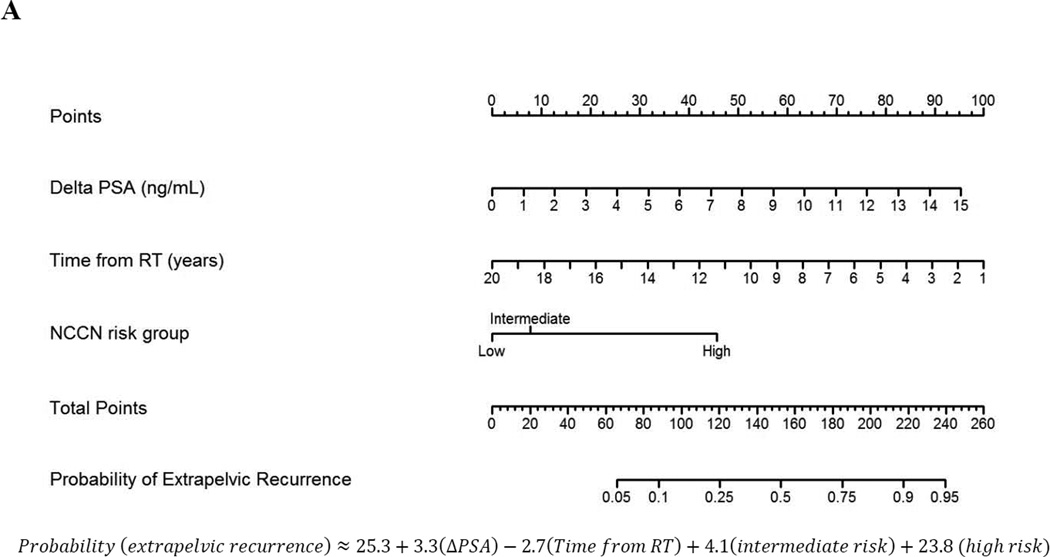
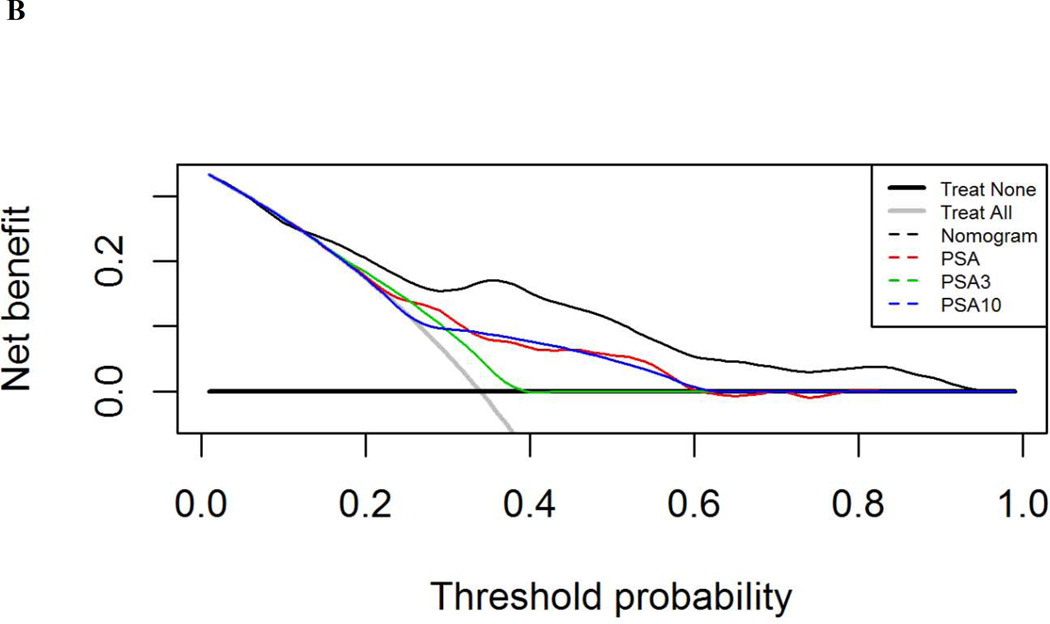
Fig. 1.
Nomogram analysis (A) calculating the probability of identifying extrapelvic and/or osseous disease on C-11 choline positron emission tomography/computed tomography at time of evaluation with a rising prostate-specific antigen (PSA) after primary radiotherapy (RT). Points are assigned by drawing a vertical line from each variable (ΔPSA, time from RT, and National Comprehensive Cancer Network [NCCN] risk group) to the “Points” line and adding the cumulative points. A line is then drawn down from the “Total Points” line at the corresponding point value. Where this line intersects with the “Probability of Extrapelvic Recurrence” line corresponds to the estimated probability of extrapelvic disease. (B) Decision-curve analysis comparing the net-benefit of using the nomogram (black dashed line) depicted above to the strategy of using PSA as a continuous predictor (red dashed line), a PSA cut-off of 3 ng/ml (green dashed line), or a PSA cut-off of 10 ng/ml (blue dashed line)


