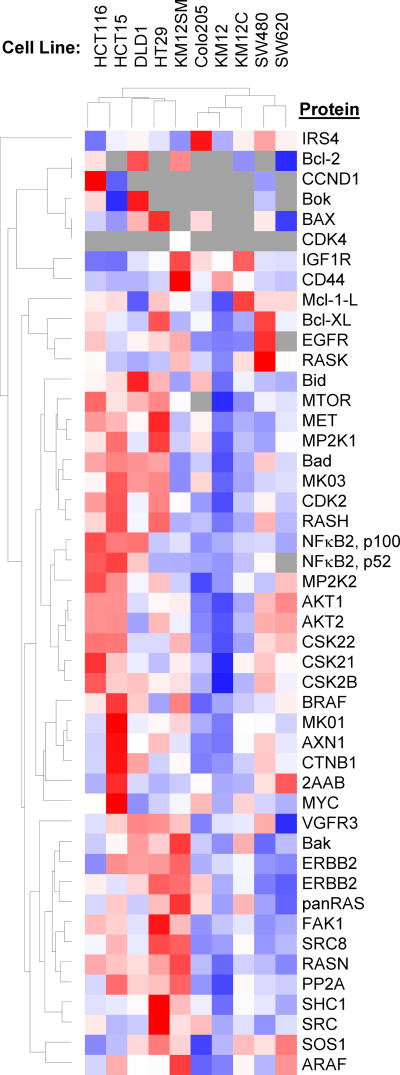
Figure 4. Heat Map and Dendrograms for the Comparison of Protein Expression in Colon Cancer Cell Lines.
Lysates from SW620, SW480, HCT15, HCT116, DLD1, HT29, KM12SM, KM12C, Colo205 and KM12 cells were analyzed. Blue indicates lowest expression levels, while red indicates highest protein expression; grey indicates that the peptide was not observed.

