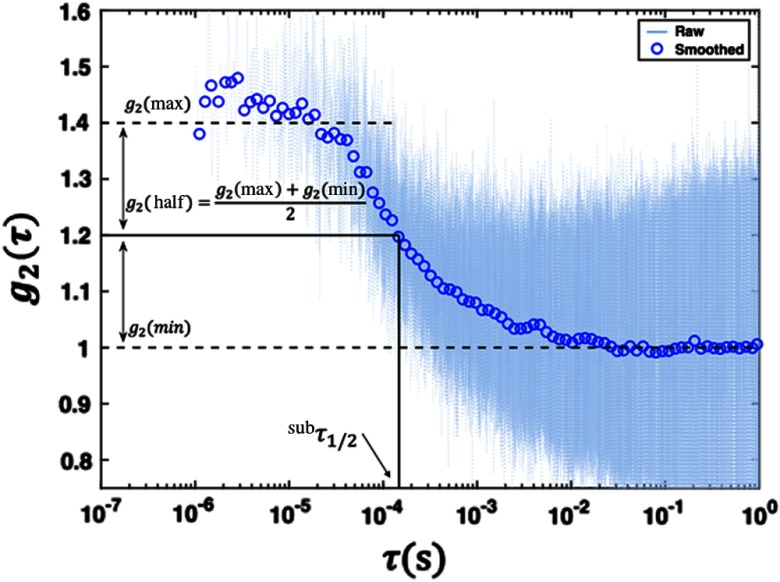
Fig. 4.
Representative curve showing the calculation from a smoothed DCS curve superimposed over the raw data—smoothed curves were obtained by applying a logarithmic filter to the raw data. values were calculated by finding the point where the autocorrelation () curve had decayed to halfway between its maximum and minimum value. Maximum (minimum) values were estimated by calculating the average value over a predefined range at the top (bottom) of the curve. A distribution of values was obtained using different sets of feasible top and bottom ranges. A representative value for each scan was calculated as the average over the distribution of values.

