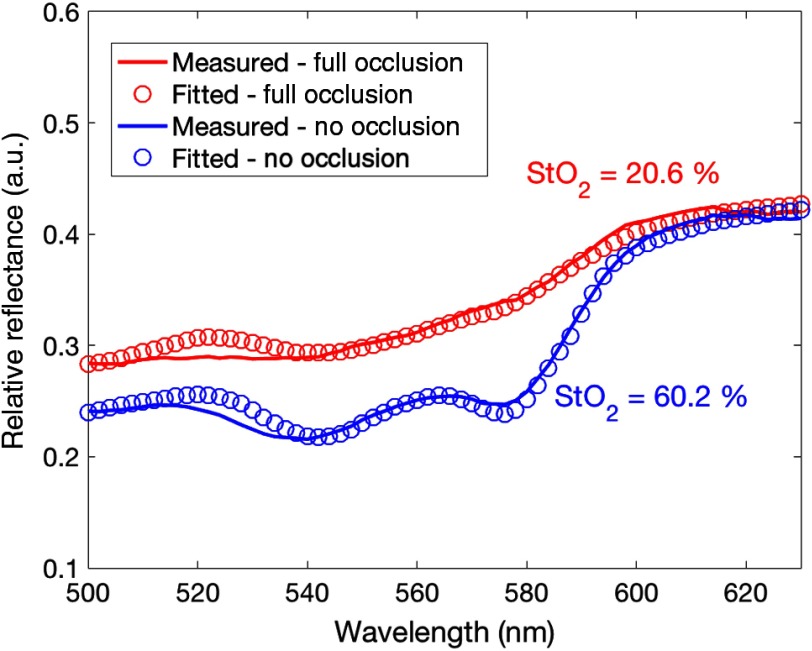
Fig. 5.
Representative reflectance spectra (solid lines) postprocessed (smoothed and corrected with the system response) at no occlusion (blue) and full occlusion (red) in pig 4 revealed a distinct difference in spectral shape. The model fits (hollow circles) based on an inverse algorithm quantified the oxygen saturation and total hemoglobin concentration.

