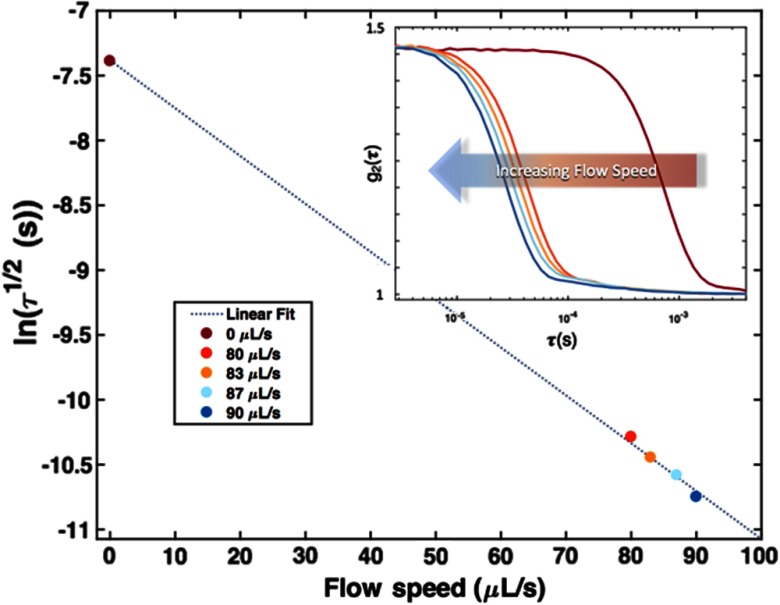
Fig. 6.
An average value was calculated for five different flow speeds from the 100 scans taken at each dial setting. The log of the average value was plotted against its corresponding flow speed as listed in the legend. The uncertainty associated with the values ranged between 5% and 6%. A linear model was fitted (dashed line) from the five data points that show a linear relation () between the flow speed and . The subplot of the average autocorrelation curves for five different flow speeds further show this relation qualitatively. An immediate leftward shift in the autocorrelation curve is observed when moving from a no-flow state (maroon curve) to a flow state (red, orange, and blue curves). A gradual shift is observed when increasing the speed of the flow state. These results indicate that the device can differentiate between a flow and no-flow state with some sensitivity to changing flow rates.

