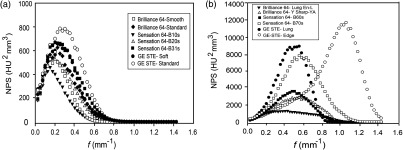
Fig. 5.
Measured 3-D NPS as a function of spatial frequency for (a) smoother kernels and (b) sharper kernels for three CT scanners. For low kernel strengths, only a slight shift in peak frequency was observed while, for high kernel strengths, the shift in peak frequency was significant, especially for GE edge kernel. Likewise, variability in CT texture features was found to be less pronounced for soft kernels than for sharper kernels. [Note the different scales along vertical axis in panels (a) and (b)].

