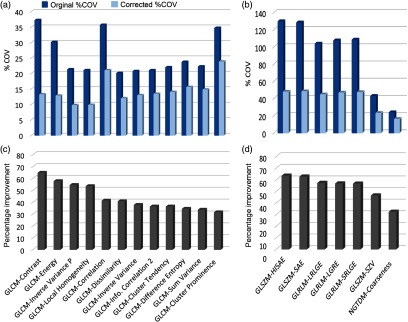
Fig. 9.
Peak frequency corrections for 19 texture features. Panels (a) and (b) show the absolute value of %COV for all reconstruction kernels before (blue bars) and after (light blue bars) peak frequency corrections. Panels (c) and (d) show corresponding percent improvement [Eq. (4)] in each feature as a result of the corrections. GLCM-contrast showed the highest improvement, whereas GLCM-cluster prominence showed the least improvement in reproducibility after corrections. [Note the different scales along vertical axis in panels (a) and (b)].

