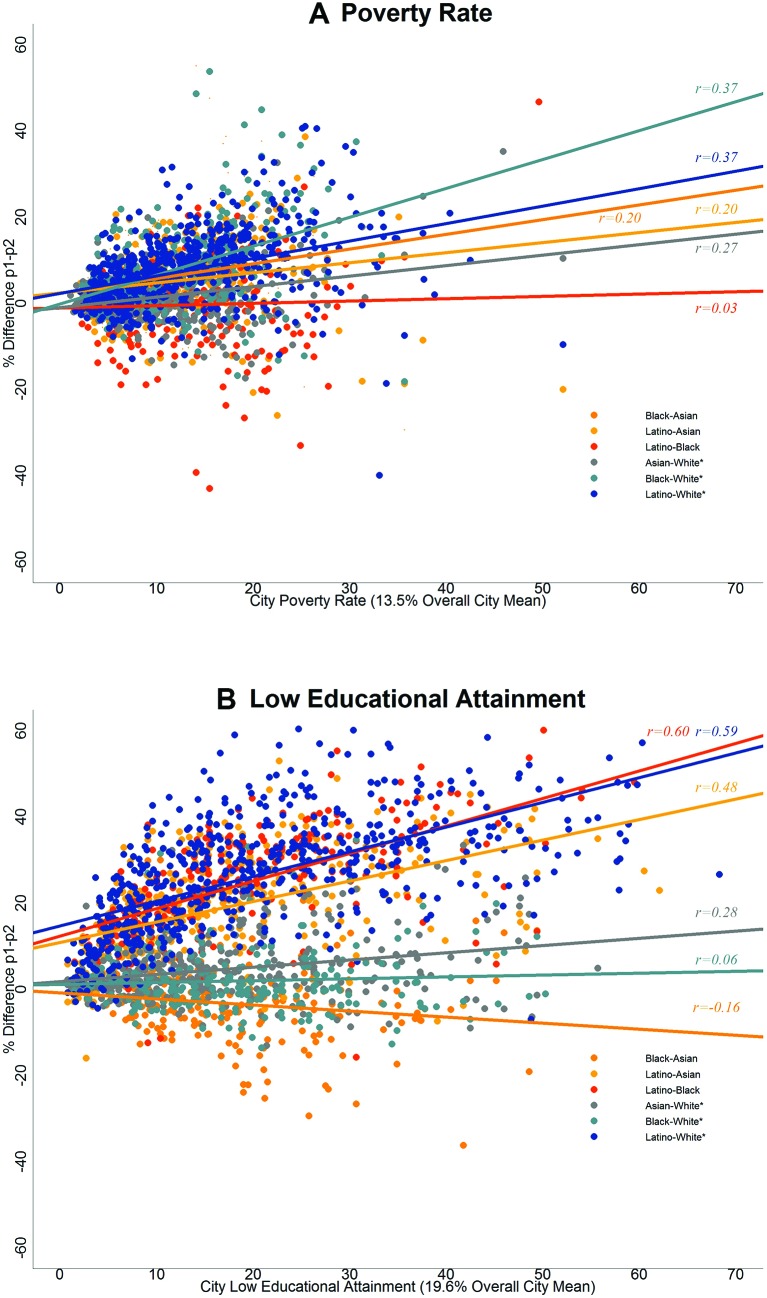
Figure 2.
(A) Within-city poverty rate differences and overall city poverty rate and (B) low educational attainment and overall city low educational attainment, California cities, 2006–2010. r is the Pearson correlation coefficient between within-city differences and the overall city value. *Considering Whites as a socially advantaged reference group, the differences that favour Whites are considered inequities.

