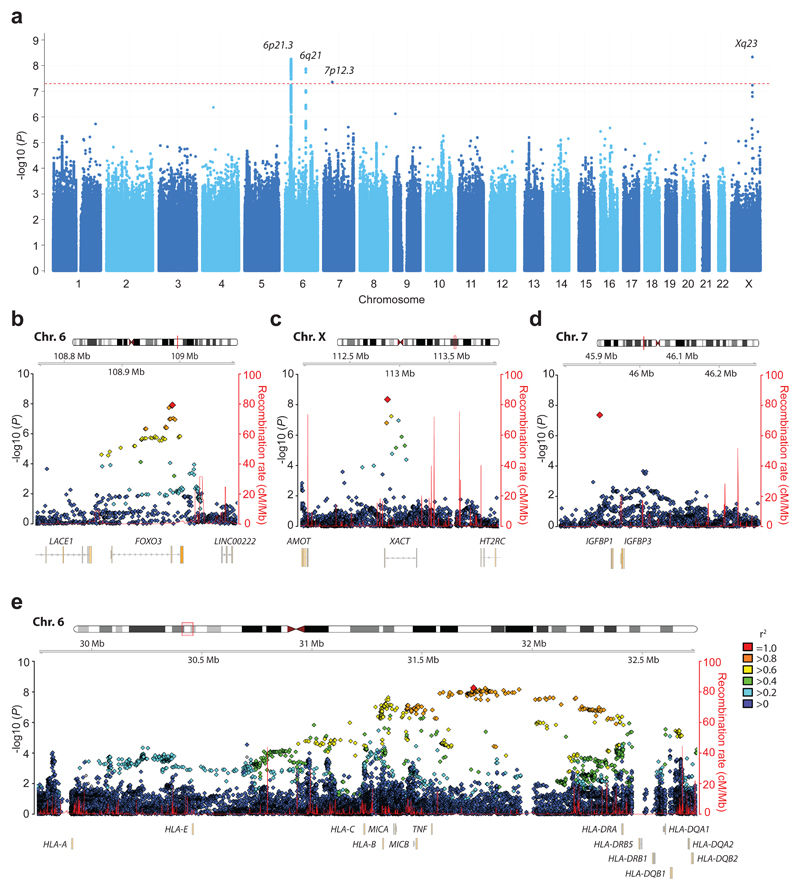
Figure 1. Within-cases GWAS identifies four loci that are associated with prognosis in CD.
(a) Plot of genome-wide association results. –log10 (P values) from the Wald statistic (logistic regression model) are plotted against chromosomal position for the combined association analysis (n = 1,762 poor prognosis CD, 972 good prognosis CD). Each point represents a SNP. Dotted red line indicates genome-wide significance threshold. The four new loci identified in this study are indicated. (b – e) Characteristics of the associated genomic regions. Upper panel, chromosomal position; middle panel, – log10 (P values) for individual SNPs at each locus (left y axis), rate of recombination indicated by red line (right y axis); lower panel, gene position within the locus (in Panel e only selected genes from class I and II regions are shown for clarity). SNPs are coloured according to LD with the most associated variant.

