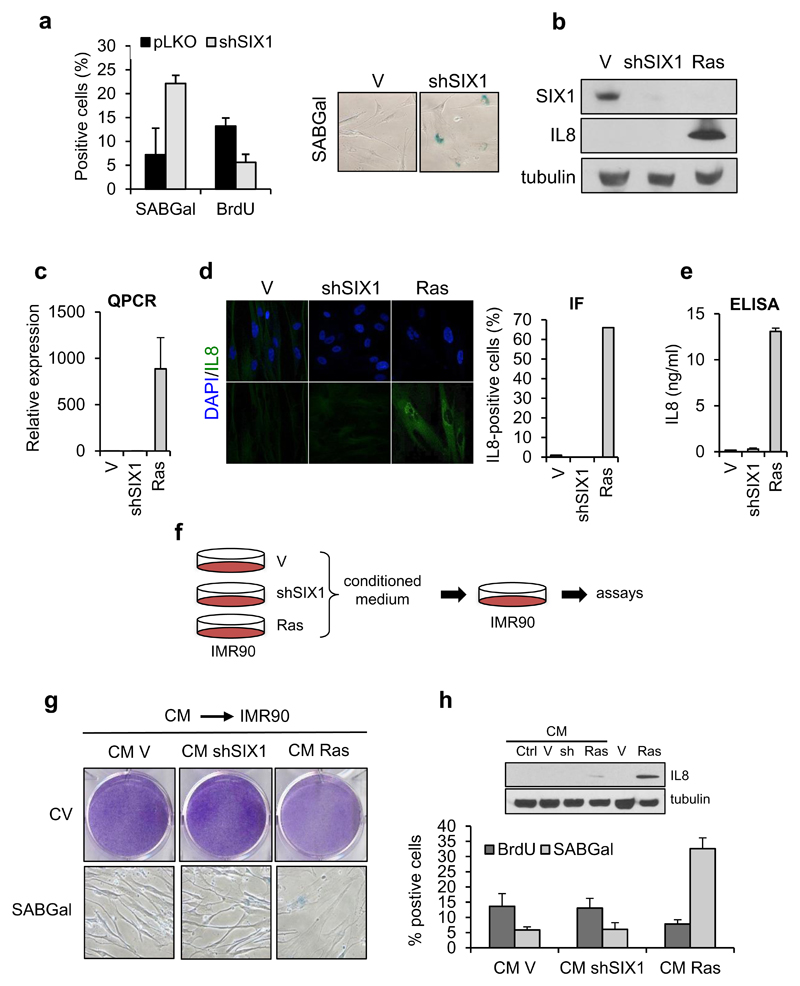
Figure 4. Characterization of the SASP in shSIX1-senescent fibroblasts.
(a) Quantification of SABGal and BrdU-positive cells (left) and micrographs showing morphology and SABGal staining (right) in shSIX1-IMR90 cells. (b, c) Western Blot (B) and QPCR analysis (C) of SIX1 and Interleukin 8 (IL8) in IMR90 fibroblasts expressing shSIX1 or RasV12 (Ras). (d) Immunofluorescence of IL8 and quantification of positive cells. (e) ELISA for IL8 with conditioned medium from the indicated cell types. (f) Experimental design of assays with conditioned medium. (g) Crystal violet staining (CV, top) and morphology and SABGal staining (bottom) of parental IMR90 cells with conditioned medium (CM) from the indicated cells. (h) Top: Western blot analysis of IL8 in IMR90 cells exposed to conditioned medium, Ctrl: control non infected cells, sh: shSIX1. Lysates form Ras-senescent and control-infected cells are included as controls. Bottom: Quantification of SABGal and BrdU-positive cells.

