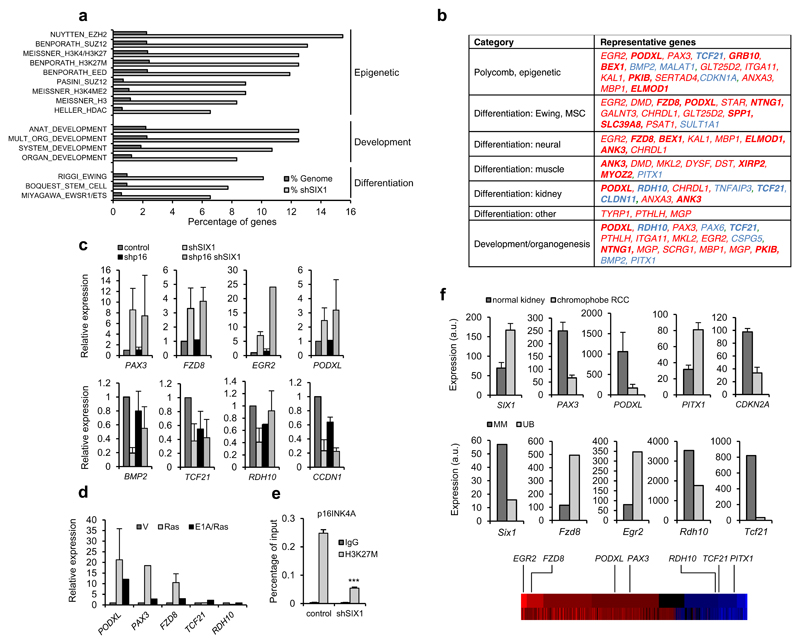
Figure 6. Expression signature of shSIX1-senescent fibroblasts.
(a) GSEA analysis of genes differentially expressed in shSIX1-senescent IMR90 fibroblasts. The percentage of genes of each category in the set of shSIX1 genes or total genome is shown. (b) Table showing representative genes of each category. Red, genes upregulated in shSIX1 cells; blue, downregulated; bold, genes with similar regulation in Ras-senescent IMR90 fibroblasts. (c) QPCR analysis of selected targets in IMR90 fibroblasts expressing shSIX1 alone or combined with shp16. Top, upregulated genes; bottom downregulated genes. (d) QPCR analysis of selected targets in Ras-senescent (Ras) or senescence-escape (E1A/Ras) IMR90 fibroblasts. (e) Chromatin immunoprecipitation assay to detect the H3K27M mark in the p16INK4A promoter in shSIX1 IMR90 fibroblasts and controls. (f) Expression of sh-SIX1-senescence genes in human normal kidney and chromophobe renal carcinoma (top) and in metanephric mesenchyme (MM) and ureteric bud (UB) of E11.5 mice (bottom). RNA expression data were retrieved from Oncomine and GUDMAP databases and Gene Expression Omnibus (GSE15641 for kidney tumor and normal tissue, and GSE6290 for mouse developing kidney). For reference, the position of the relevant genes in a heatmap representation of their expression in shSIX1 IMR90 cells is included (red, upregulated; blue, downregulated genes).

