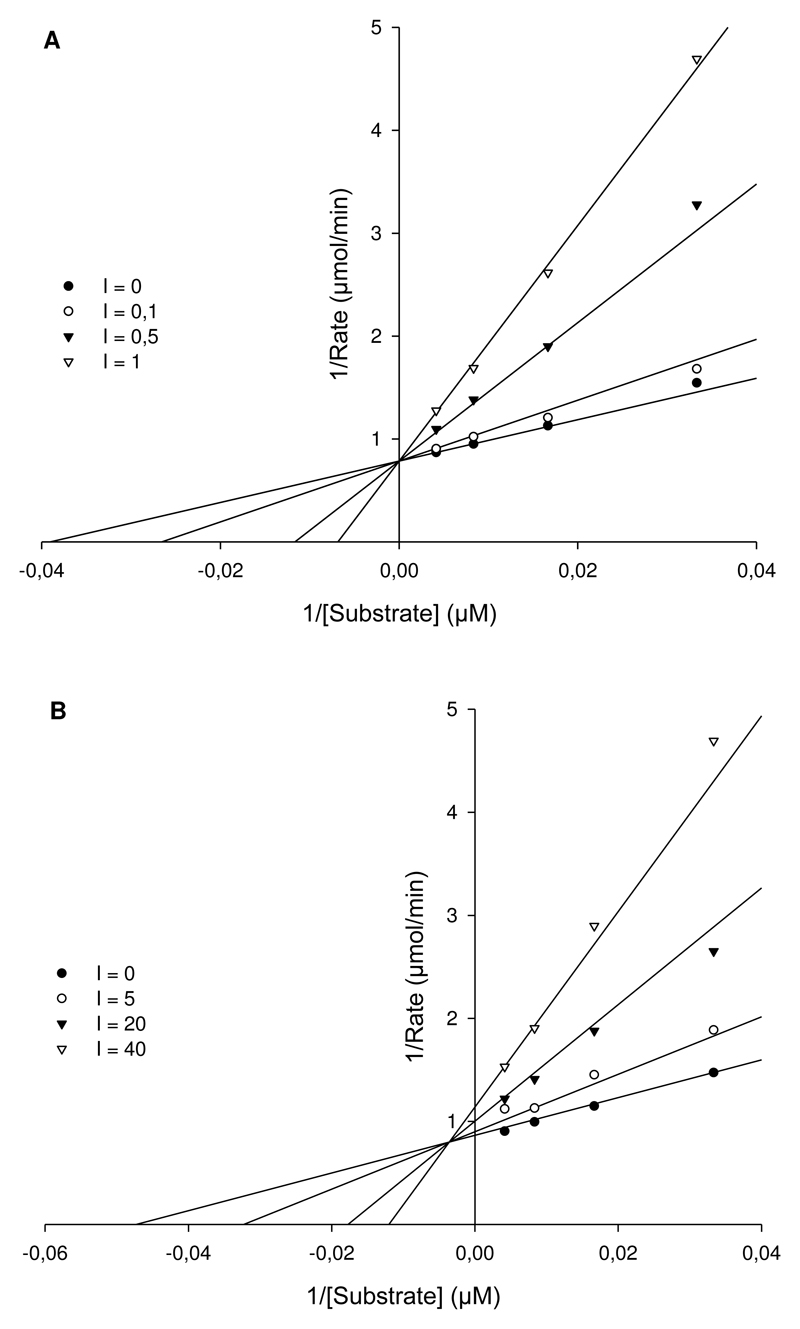
Figure 2.
Lineweaver-Burk plot analysis of the inhibition mechanism of NAI. (A) Competitive inhibition of oseltamivir at concentrations of 0.0, 0.1, 0.5 and 1 μM. Regardless of the presence of oseltamivir, Vmax is invariant, however, the increase in concentration of oseltamivir led to the raise of Km. (B) Mixed inhibition of artocarpin at concentrations of 0, 5, 20 and 40 μM. The presence of artocarpin resulted in a decreased Vmax and increased Km. The Ki values of oseltamivir and artocarpin are 0.23±0.04 μM and 9.68±1.49 μM, respectively.

