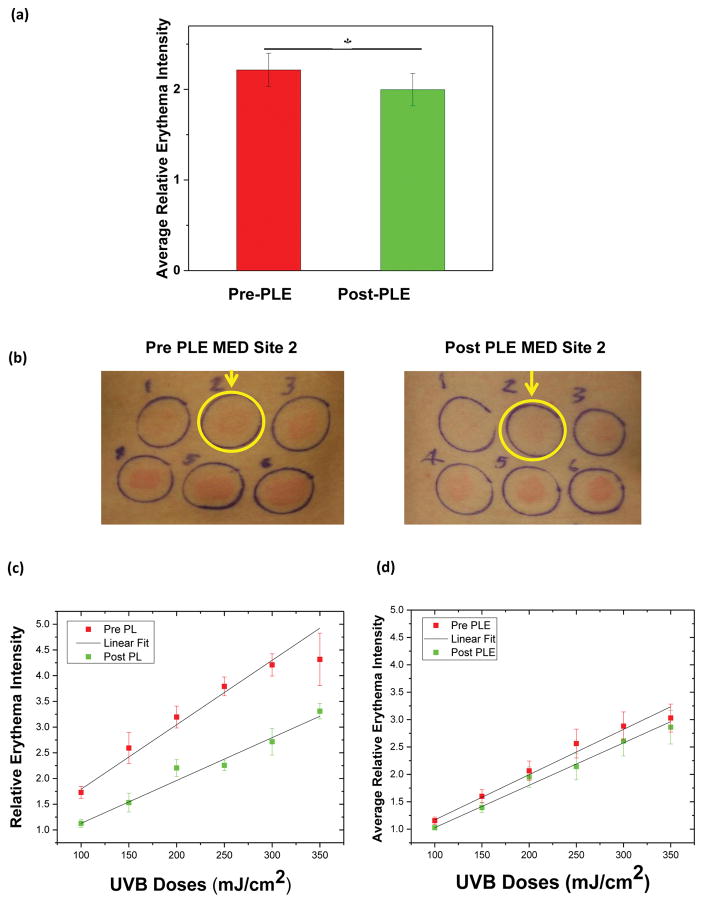
Figure 3.
(UVB response) (a) Average pre -and post -PLE relative erythema intensity. Mean ± standard error of the mean. Asterisk represents statistically significant change (P <.05). (b) Pre-PLE MED site 2, 150 mJ/cm2 (left), post-PLE MED site 2, 150 mJ/cm2 (right), is a set of representative clinical photographs demonstrating the decrease in erythema intensity although no change in MED. (c)Pre and post -PLE relative erythema intensity as a function of UVB dose for 1 subject. Mean ± standard deviation. The pre PLE MED for this subject was 100 (linear range 50 – 280 mJ/cm2) and post-PLE MED was 150 (linear range 75–420 mJ/cm2). Although all data points have been shown in the graph, slopes were calculated corresponding to the linear section only. (d) Average pre and post-PLE relative erythema intensity for all subjects as a function of UVB doses. Mean ± standard error of the mean. Abbreviations: MED, minimal erythe ma dose; PLE, Polypodium leucotomos extract; UVB, ultraviolet B.

