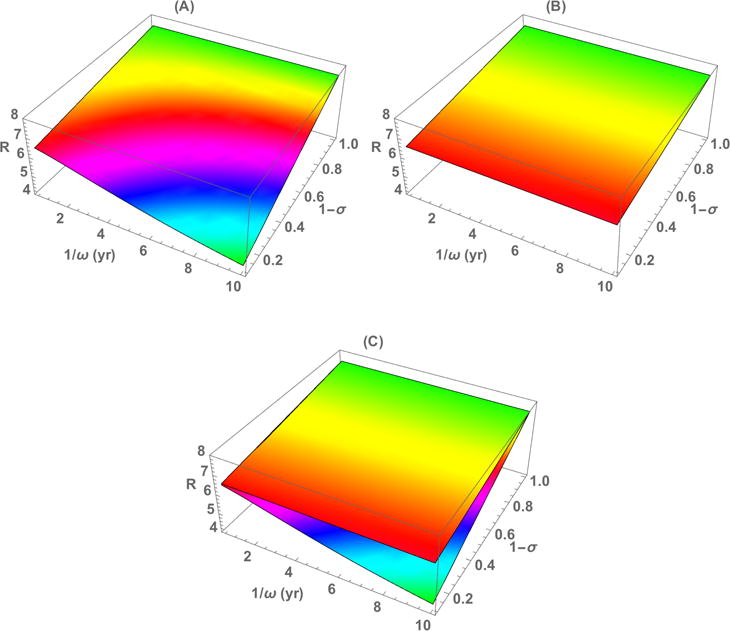
Figure 1.

Plots of ℛ as a function of immunity period 1/ω and proportion of newborns with passive immunity 1 − σ for Model I (A) and Model II (B). The two surfaces in (A) and (B) are superimposed in (C). See the text for parameter values used and additional explanation.
