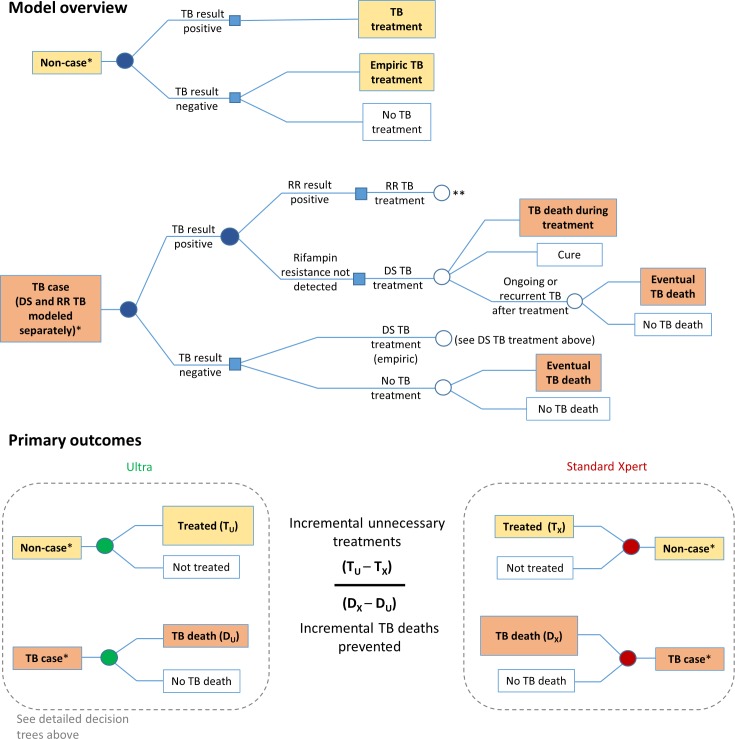
Fig 1. Markov model description.
The model diagram shows how an individual suspected of having TB progresses through diagnostic evaluation, treatment decisions, and clinical outcomes. Filled circles indicate diagnostic evaluation with Xpert MTB/RIF (either standard Xpert or Ultra). The lower panels illustrate how primary outcomes—incremental unnecessary TB treatments resulting from Ultra, incremental TB deaths prevented by Ultra, and their ratio—are determined. *Each individual (whether a case or a non-case) is also assigned an HIV status, TB treatment history, age, and sex; these determine the subsequent probabilities within the Markov model. **RR TB treatment is followed by the same decision trees as DS TB treatment, but with different associated probabilities of death and cure, as shown in Table 2. DS, drug-susceptible; RR, rifampin-resistant; TB, tuberculosis.

