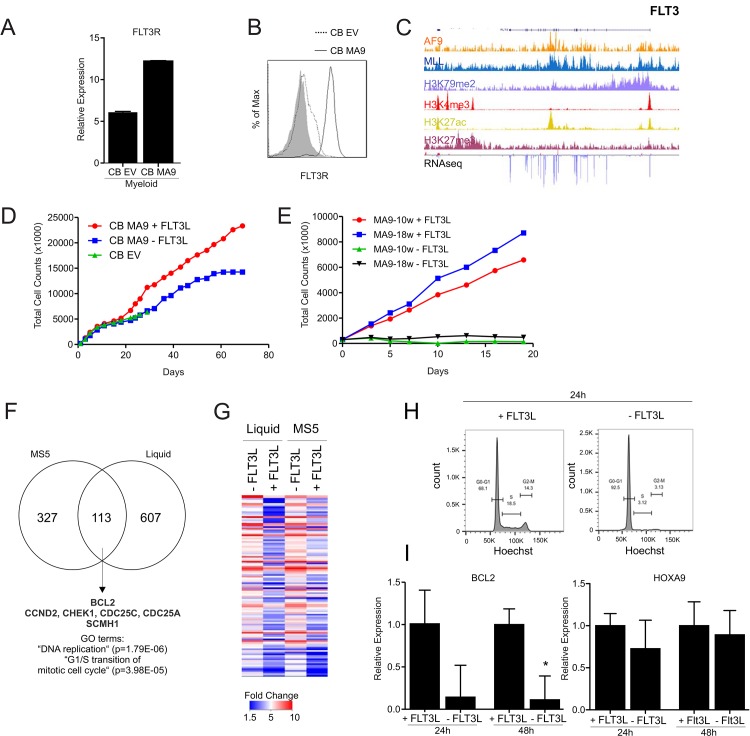
Fig 4. BCL2 downmodulation upon FLT3-L deprivation.
A) mRNA expression of the FLT3 receptor in CB transduced MLL-AF9 cells (myeloid and lymphoid) versus empty vector control. B) FACS analysis of the FLT3 receptor in myeloid CB transduced MLL-AF9 cells versus empty vector control. C) ChIP-seq occupancy profiles of AF9, MLL, H3K79me2, H3K4me, H3K27Ac, H3K27me3 at FLT3 locus in THP1 cells. RNAseq tracks are shown as well. D) Total cumulative cell count for MS5 co-culture of freshly transduced CB MLL-AF9 cells under myeloid restrictive condition, in the presence or absence of the FLT3 ligand. E) Total cumulative cell count for week 10 or week 18 transformed CB MLL-AF9 cells on MS5 stroma that were deprived of FLT3-L or not for a period of 2.5 weeks. F) Venn diagram representing genes down-regulated at least 2-fold in immortalized CB MLL-AF9 cells in the presence or absence of FLT3L after 48 hours in liquid cultures or in MS5 cocultures. G) Heatmap displaying the 113 commonly down-regulated genes in liquid and MS5 co-culture setting. H) Cell cycle analysis by FACS of immortalized CB MLL-AF9 cells in the presence or absence of the FLT3-L after 24h in liquid culture conditions. I) Q-RT-PCRs were performed to determine gene expression levels of BCL2 and HOXA9 after 24 and 48 hours of FLT3L deprivation.

