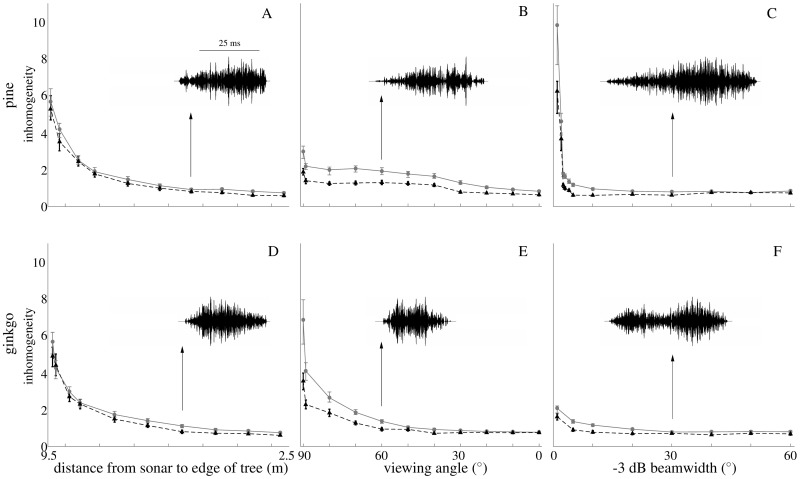
Fig 6. Echo envelope inhomogeneity for the L-system tree models compared to a uniform-distribution model reference.
Solid lines: L-system tree models, dashed lines: uniform-distribution model. A) and D) Straight approach towards the foliage (A pine, B ginkgo); B) and E) Angular scan with viewing angles ranging from 90° to 0° (oriented straight at the center, B) pine, E) ginkgo); C) and F) Change in -3 dB beamwidth (C pine, F ginkgo). The leaf density of the uniformly distributed reference models was adjusted in each condition to match the number of leaves in the sonar beam of the two L-system models. In addition, the size of the leaf domain in the uniform leaf distribution model was adjusted to match the echo length in L-systems. Each point represents the mean of 100 experiments, the error bars indicate the minimum and maximum values in each data set. The insets in each panel show an example waveform with a parameter value in the middle of the range shown in the main figure. Inhomogeneity is the root mean square of the difference between the two means (mean of original envelope and mean of permuted envelope) across 100 windows.

