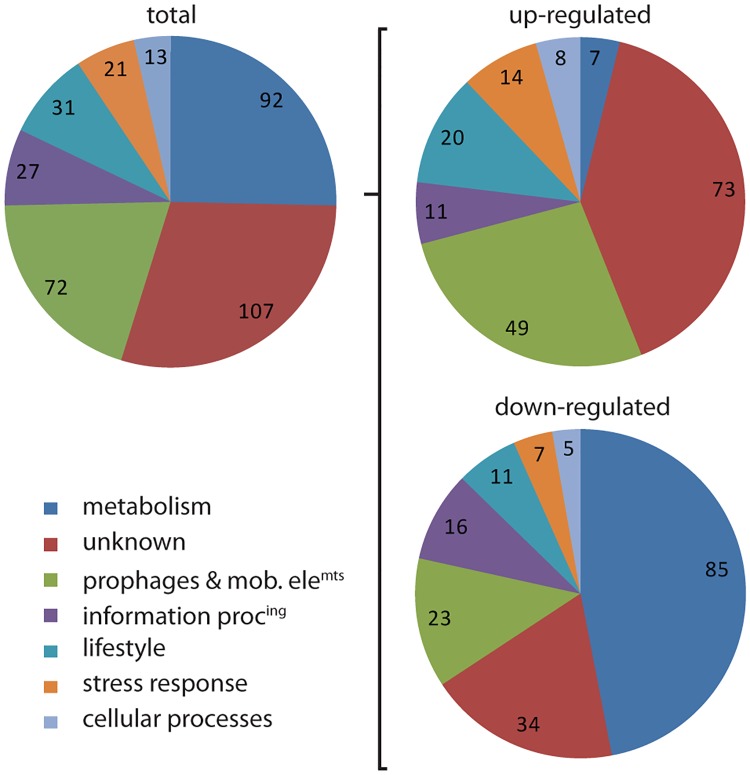
Fig 5. The YdcH regulon.
Pie charts summarizing genome-wide transcriptional profiling by RNAseq comparing gene expressions in a WT (ABS2005) and a ΔydcH strain (ASEC56). The 363 genes retained (left chart) were reproducibly and statistically induced (182, right up) or repressed (181, right down) in the mutant compared to the wt by at least a two-fold factor. Genes were sorted by functional categories (see S5 Table for complete results), then regrouped into families of functions: Metabolism (carbon sources, amino acids, lipids, nucleotides and other metabolic pathways; electron transport & ATP synthesis; transport of sugars and other metabolites), stress response, information processing (DNA replication, segmentation, modification, recombination and repair; RNA and protein synthesis, modification and degradation), cellular processes (cell division; cell envelope synthesis, modification and degradation; ion homeostasis), lifestyles (motility & chemotaxis; biofilms formation; competence; sporulation), prophages & mobile genetic elements, and unknown. Numbers indicate the number of gene for each category.

