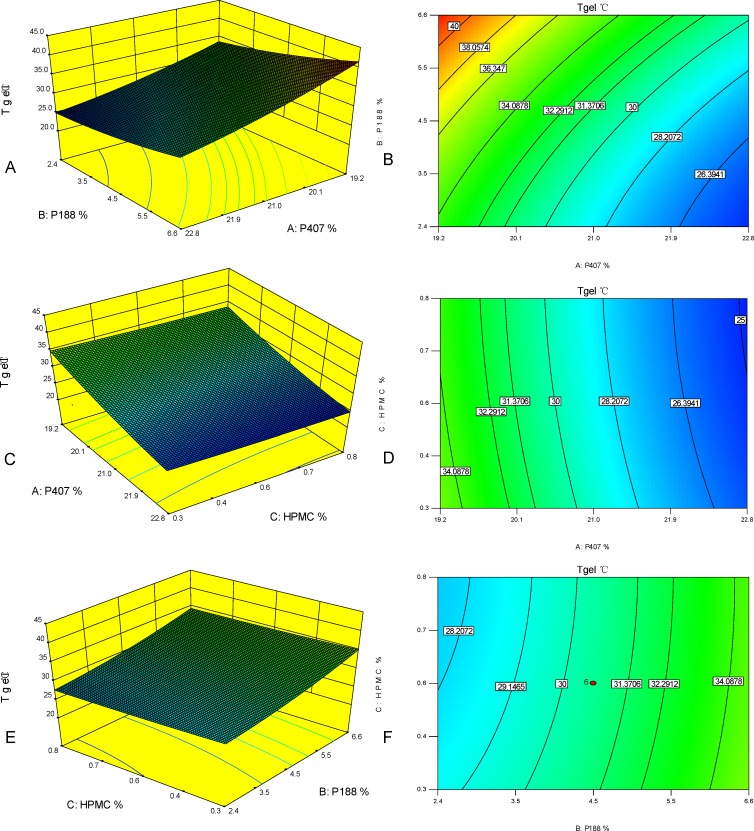
Fig 1. Three-dimensional surfaces and contours showing the influences of P407, P188 and HPMC.
(A) 3D surface plot of P407 and P188 on Tgel (HPMC = 0.4%). (B) Contour of P407 and P188 on Tgel (HPMC = 0.4%). (C) 3D surface plot of P407 and HPMC on Tgel (P188 = 3.1%). (D) Contour of P407 and HPMC on Tgel (P188 = 3.1%). (E) 3D surface plot of P188 and HPMC on Tgel (P407 = 21.0%). (F) Contour of P188 and HPMC on Tgel (P407 = 21.0%).

