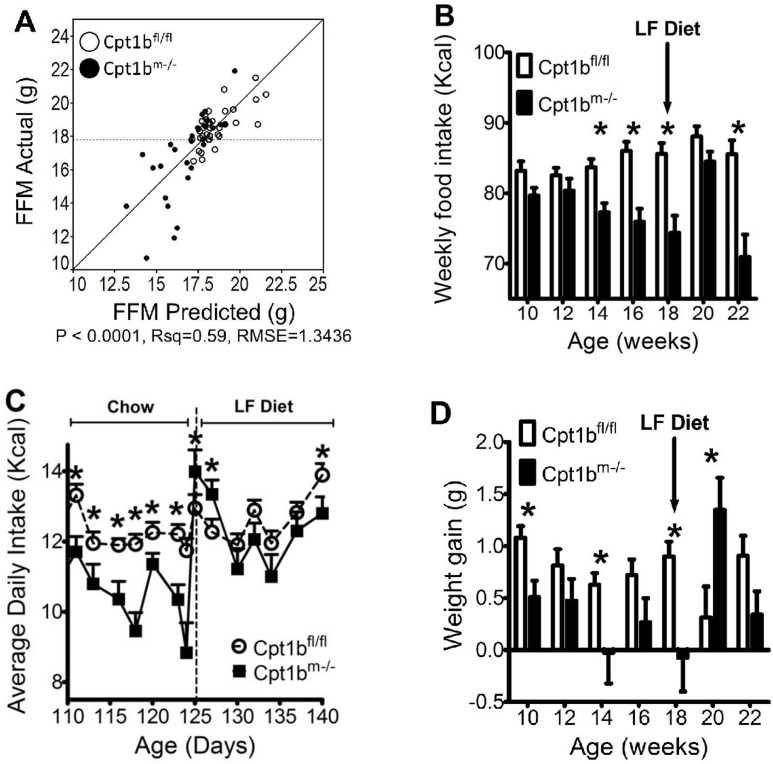
Fig 2. Increased caloric intake as a result of low fat feeding explains increased gain of FFM.
(A) ANCOVA analysis conducted by varying FFM as a function of genotype and average daily Kcal intake. White circles represent control mice, while black circles represent Cpt1bm-/- mice. (B) Average weekly Kcal intake is plotted for control (white) and Cpt1bm-/- (black) mice during this food switching study. (C) Average daily food intake was monitored for control (white circles) and Cpt1bm-/- (black squares) mice that were fed 25% fat diet for 125 days, followed by switching to low fat diet. (D) Average weekly weight gain during this food switching study is shown for control (white) and Cpt1bm-/- (black) mice. N = 15 animals per genotype for chow diet and N = 10 animals per genotype for low fat diet. Asterisks indicate significance with P ≤ 0.05.

