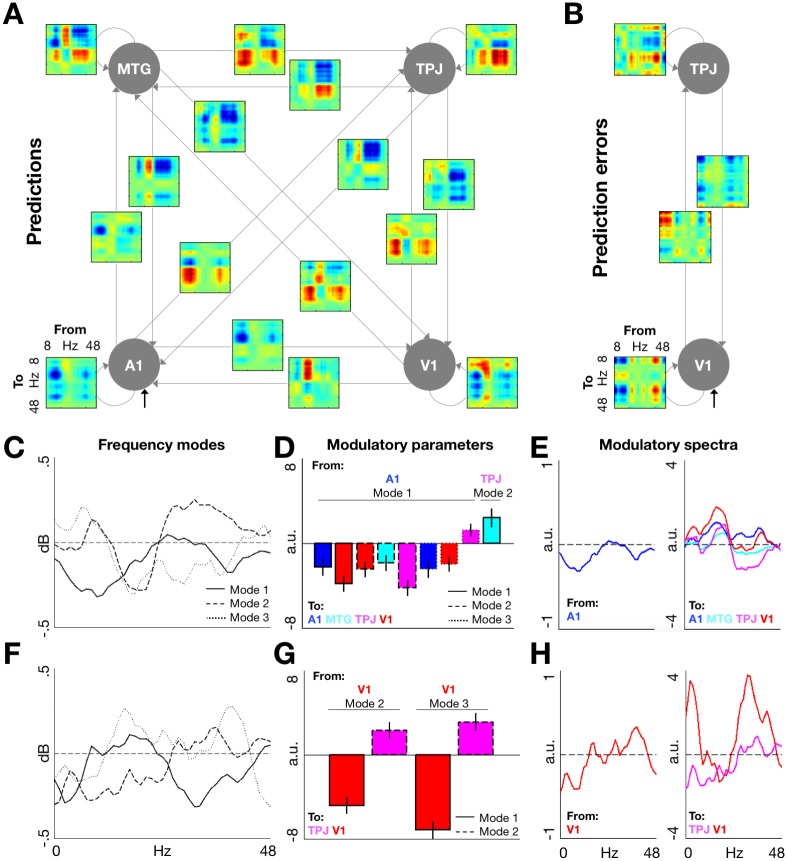
Fig 4. DCM.
(A) Frequency-by-frequency maps of modulatory effects of contextual relevance on prediction processing. Effects were modelled in a network of 4 interconnected areas, corresponding to the 4 regions in which significant effects of relevance on prediction-related responses were identified (cf. Fig 3B). (B) The corresponding maps of modulatory effects of contextual relevance on PE processing, modelled in a network of 2 areas in which significant effects were identified (cf. Fig 3C). (C) Principal frequency modes estimated for prediction-related responses across the modelled areas. (D) Significant modulatory parameters corresponding to the effects of contextual relevance on prediction-related responses. Each bar represents a significant modulation (by contextual relevance) of the influence of a particular frequency mode in 1 region on another frequency mode in another region. (E) Modulatory spectra of the relevance-related effects of A1 activity (left panel, corresponding to Mode 1) on prediction-induced activity in all regions (right panel, corresponding to an average across frequency modes weighted by the respective modulatory parameters). (F-H) Same as (C-E) but for PE processing (H, left panel: an average of Modes 2 and 3). Data pertaining this figure are available on Figshare https://figshare.com/s/2d2755bfdeea1cbb415f. A1, primary auditory cortex; DCM, dynamic causal modelling; MTG, middle temporal gyrus; PE, prediction error; TPJ, temporoparietal junction; V1, calcarine cortex.

