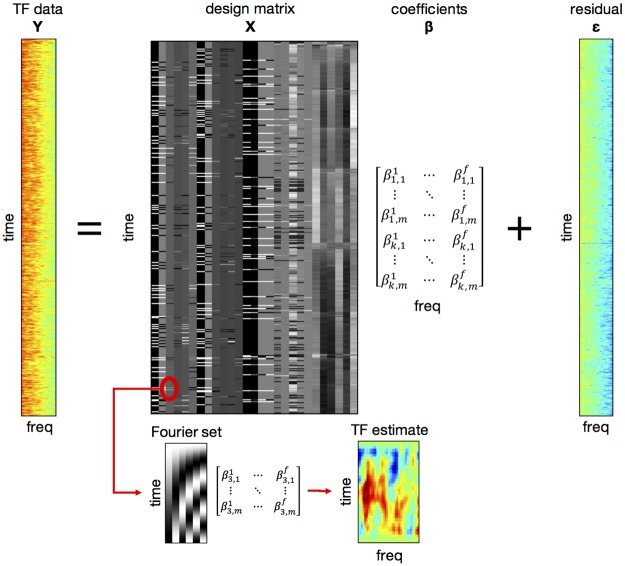
Fig 5. Convolution modelling for TF responses.
TF data from the entire experiment (without epoching) were modelled using a GLM approach, with the design matrix specifying event and nuisance regressors (columns, left to right: cue onset and its 5 modulation regressors; target onset and its 5 modulation regressors; response onset and its 3 modulation regressors; 5 EOG and pupil size nuisance regressors; 6 motion regressors; see main text for details). Because each regressor was modelled as a Fourier time series (inset below), the resulting Fourier coefficients (here depicted for the third out of k columns and corresponding to parameter estimates for m basis functions and f frequencies) constitute a deconvolved TF response to each event type and/or parametric regressor. Data pertaining this figure are available on Figshare https://figshare.com/s/2d2755bfdeea1cbb415f. GLM, general linear model; EOG, electrooculography; freq, frequency; TF, time-frequency.

