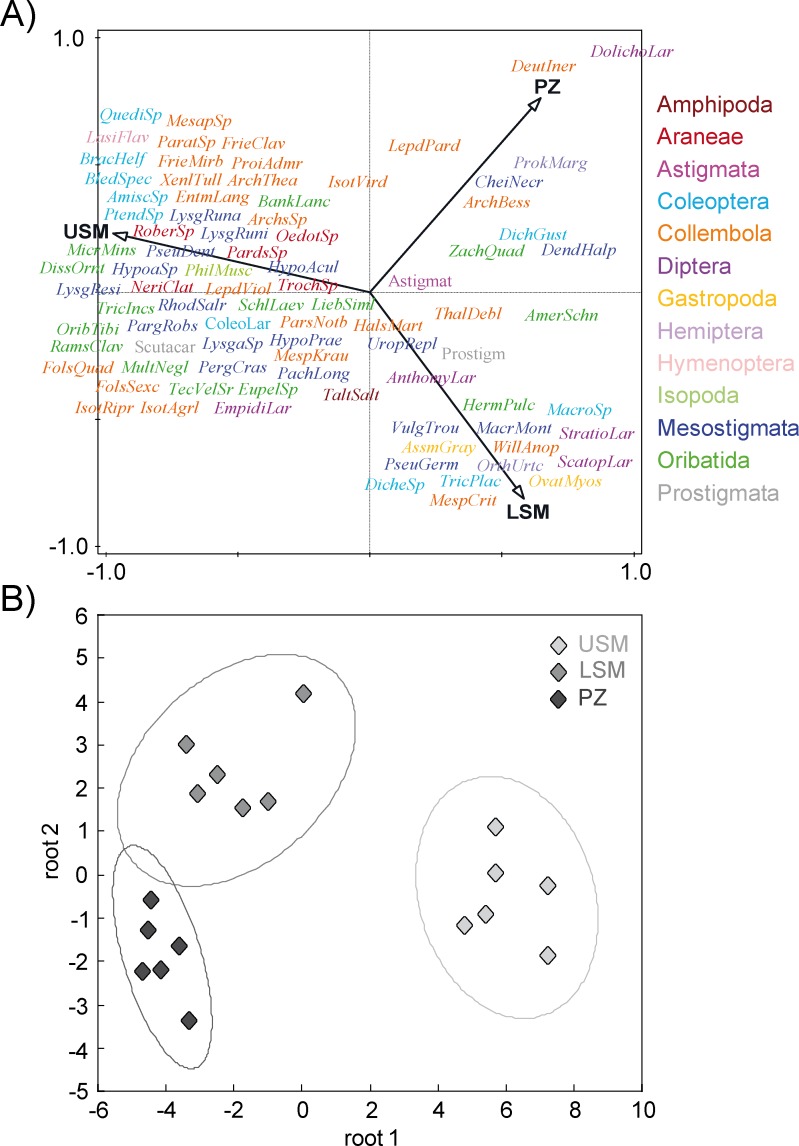
Fig 2.
(A) Soil mesofauna community structure: canonical correspondence analysis (CCA) based on the density of 86 soil animal taxa (log-transformed) along the studied salt marsh gradient: upper salt marsh (USM), lower salt marsh (LSM) and pioneer zones (PZ). For full species names see Table A in S1 File. Eigenvalues of axis 1 = 0.6610 and axis 2 = 0.3214. (B) Discriminant function analysis (DFA) of soil invertebrate community of the three salt marsh zones: USM, LSM and PZ; ellipses represent confidence ranges at p < 0.05.

