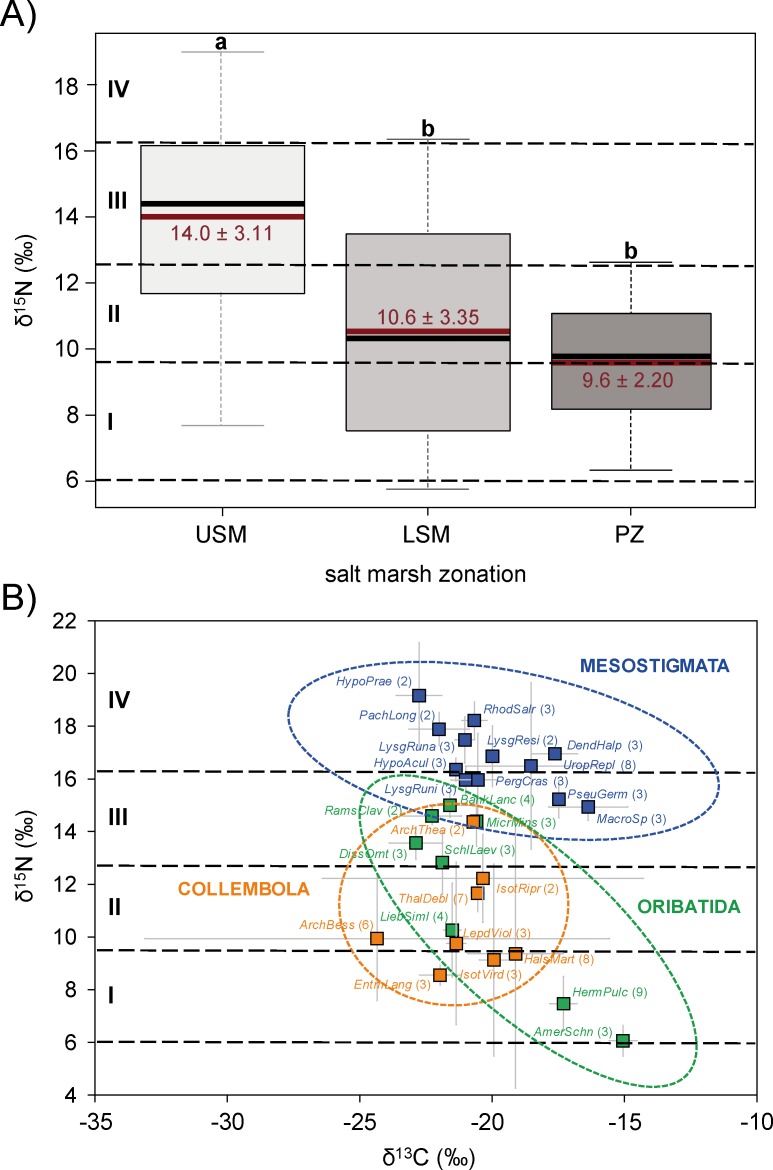
Fig 4.
(A) δ15N signatures of all soil mesofauna species in the upper salt marsh (USM), lower salt marsh (LSM) and pioneer zone (PZ). Boxplots represent mean (red line) and median (black line) of δ15N signatures; different letters represent significant differences between zones (Tukey’s HSD; p < 0.05). (B) δ13C and δ15N stable isotope values (means with standard deviation) of dominant mesofauna species: Collembola (orange squares), Mesostigmata (blue squares) and Oribatida (green squares). Black dashed horizontal lines represent estimated trophic level boundaries with each trophic level spanning 3.4‰ δ15N: I = primary decomposers, II = secondary decomposers, III = first order predators, and IV = second order predators. Number of replicates are included in parentheses; see Table C in S1 File for full species names.

