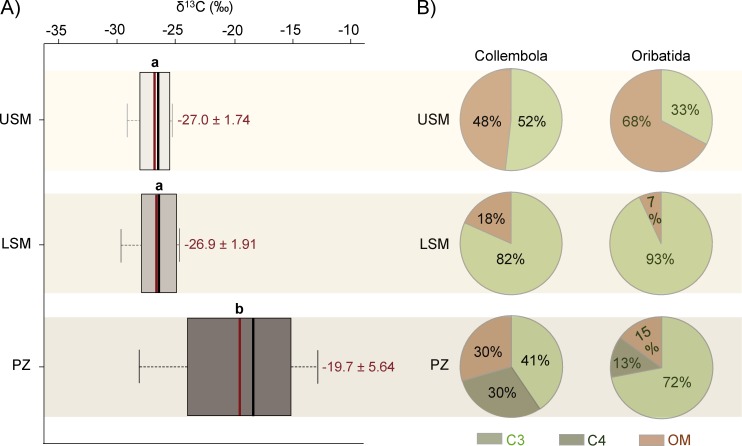
Fig 5.
(A) δ13C signatures of basal food resources in the three salt marsh zones: upper salt marsh (USM), lower salt marsh (LSM) and pioneer zones (PZ). Boxplots represent mean (red line) and median (black line) of δ13C signatures; different letters represent significant differences between vegetation zones (Tukey’s HSD, p < 0.05). (B) Pie charts represent mean percentages of potential food resources [C3 plants/algae, C4 plants/algae and organic material (OM) containing C3 and/or C4 plants/algae] of Collembola and Oribatida species along the salt marsh gradient.

