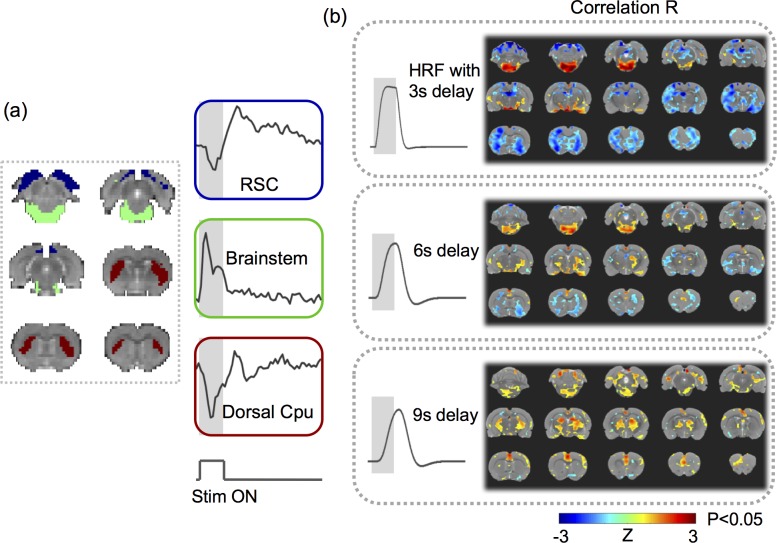
Fig 2. VNS-evoked responses varied across regions.
(A) shows the response time series averaged within each of the three regions of interest: the retrosplenial cortex (RSC) (blue), the brainstem (green), and the dorsal caudate putamen (Cpu) (red). (B) shows the highly different activation maps based on the response models derived with the HRF, for which the peak latency was assumed to be 3s, 6s, or 9s. The color shows the group average of the z-transformed correlation between the voxel time series and the modeled response. The maps were thresholded with p<0.05 (one-sample t-test, uncorrected).

