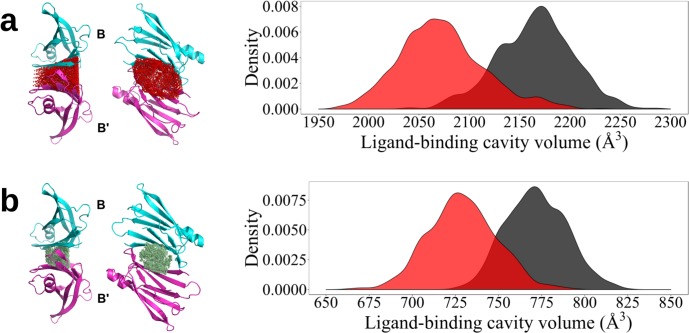
Fig 4. Ligand-binding cavities and their corresponding thermal fluctuations.
Ligand cavities are defined according to (a) the 33 residues per subunit and (b) only the 10 buried residues, all listed in Table 4. The corresponding distributions of volumes, calculated for a large number of structures representing thermal distortions of the crystal structure of the wild type ligand-free TTR tetramer (PDB 1F41), are depicted as kernel density plots for the cavities either at the A-A’ or at B-B’ (bold) interfaces, respectively.

