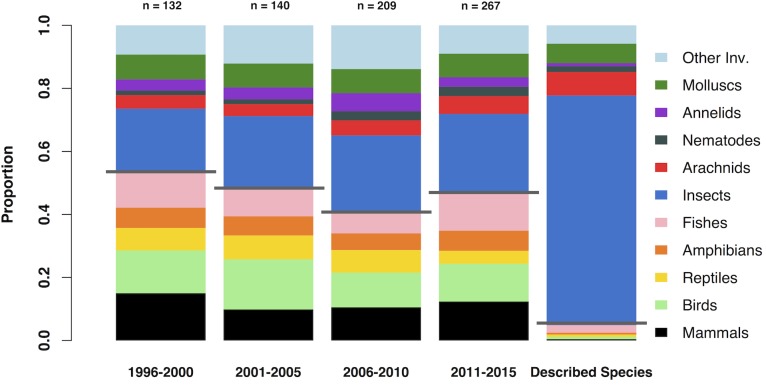
Fig 2. The proportions of different animal taxa studied in biodiversity research over the last 20 years.
The proportion of different taxonomic groups in the sample of papers with ‘biodiversity’ in the title is shown for 4 five-year periods since 1996. For comparison, the right-hand column illustrates the ‘true’ proportions of described species that each group makes up (data from IUCN [20]) Vertebrate and invertebrate taxa are separated by a grey line.

