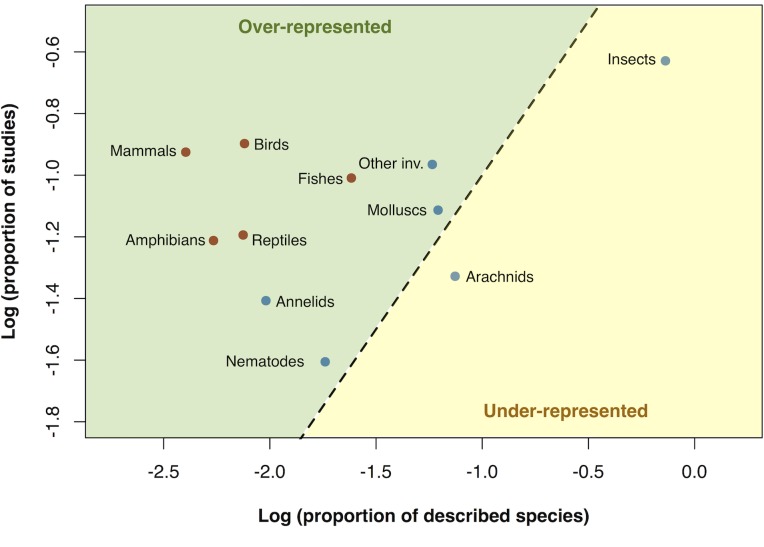
Fig 3. The over- and under-representation of different animal groups in biodiversity research relative to the number of described species.
The proportion of studies on each taxonomic group is plotted against the ‘actual’ proportion of described species [20] found in that taxon. Values were log transformed for clarity. The 1:1 line is shown (dotted); over-represented groups are found above the line while under-represented groups are below it. Vertebrate groups are shown in red and invertebrate groups are shown in blue.

