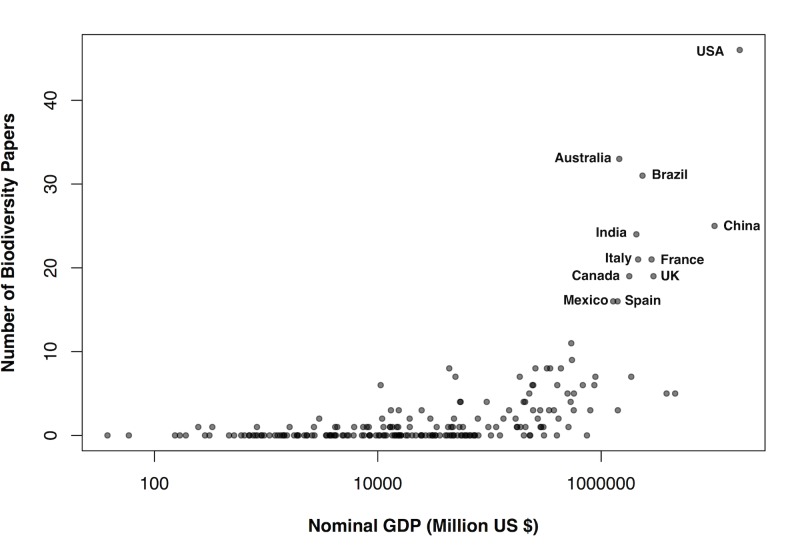
Fig 7. The number of biodiversity papers in a country related to its GDP.
Nominal GDP in US$ is plotted against the number of biodiversity studies sampled from each country, revealing a positive relationship. The top ten countries for number of papers are labelled. Many countries with low GDP had no biodiversity papers identified from this sample.

