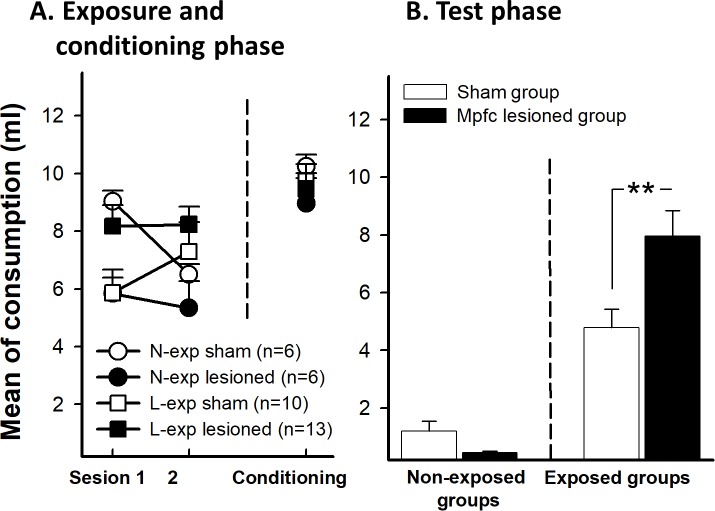
Fig 6.
A. As experiment 2, the graph shows the mean saccharin intake during the two sessions of preexposure (left) and conditioning phase (right) for sham and mpfc lesioned animals (L-exp and N-exp). B. Mean of saccharin intake in limited exposure (L-exp) of the future CS in sham and mpfc lesioned groups. Error bars represent SEMs. Asterisks indicates p<0.01. N-exp: non exposed groups, L-exp: limited exposure groups.

