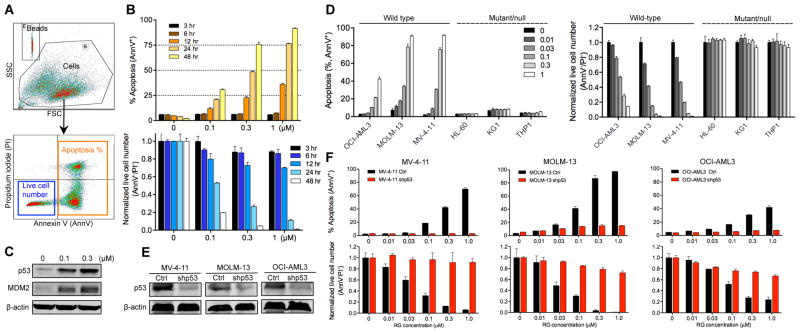
Figure 1. MDM2 Inhibitor RG Activates p53 and Induces Apoptosis in a p53-Dependent Manner.
(A) Flow cytometry plots showing the gating strategy to determine apoptosis (AnnV+) and the numbers of live cells (AnnV−/PI−).
(B) Time- and dose-dependent induction of apoptosis and reduction of live cell numbers by RG in MV-4-11 cells.
(C) Immunoblots of p53 and MDM2 in MV-4-11 cells after RG treatment for 8 hr. β-actin served as the loading control.
(D) Sensitivity comparison of p53WT and p53 deficient AML cells. AML cells were treated with indicated concentrations of RG for 48 hr.
(E) Immunoblot showing p53 knockdown by lentiviral shRNA in three AML cell lines. The cells were treated with 1 μM RG for 12 hr to induce p53 prior to immunoblotting.
(F) Sensitivity comparison of control and p53 knockdown AML cells. Cells were treated with indicated concentrations of RG for 48 hr.
Cell numbers were enumerated by flow analysis using CountBright counting beads and normalized to untreated controls (B, D, F). Data in the bar graphs (B, D, F) represent the means of triplicate experiments. Error bars, mean ± SD. See also Figure S1.

