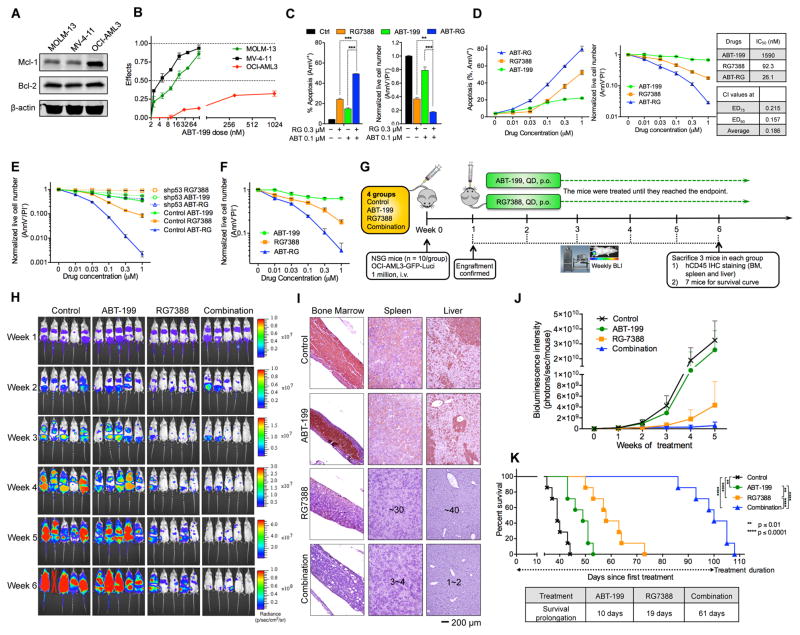
Figure 3. p53 Activation by RG Abrogates Inherent Resistance to Bcl-2 Inhibitor ABT.
(A) Basal expression of Mcl-1 and Bcl-2 in MOLM-13, MV-4-11, and OCI-AML3 cells.
(B) AML cells were treated with ABT for 48 hr. Effects = 1 – live cell numbertreated/live cell numbercontrol.
(C, D) OCI-AML3 cells were treated with indicated compounds at a 3:1 ratio (C) or a 1:1 ratio (D) for 48 hr. The combination index (CI) and IC50 values were calculated using Calcusyn software based on live cell numbers. ED75, 75% effective dose; ED90, 90% effective dose.
(E) Comparison of live cell numbers in control and p53 knockdown OCI-AML3 cells after treatment with ABT, RG, or ABT/RG combination for 48 hr.
(F) Reduction of live cell numbers of luciferase-labeled OCI-AML3 cells after 48 hr treatment with ABT, RG, or ABT/RG in vitro.
(G) Schematic outline of the mouse model of inherent ABT resistance (OCI-AML3).
(H) Serial bioluminescence images of OCI-AML3–engrafted NSG mice. Treatment was initiated on day 7 after confirmation of engraftment.
(I) Representative IHC staining of murine BM, spleen, and liver for human CD45 antigen at week 6. Three mice from each group were sacrificed. Countable numbers of hCD45+ cells were marked on each slide.
(J) Quantitation of bioluminescence emitted from the whole body of each mouse. Data represent the mean ± SD of 5 examined mice in each group as shown in (H).
(K) Kaplan-Meier survival curves of mice injected with luciferase-labeled OCI-AML3 cells (n = 7 per group; statistical significance and median survival were evaluated using the log-rank test).
Data in the bar/line graphs B–F represent the means of triplicate experiments with error bars indicating SD. **p < 0.01, ***p < 0.001 as determined by two-tailed unpaired Student’s t-test. See also Figure S3.

