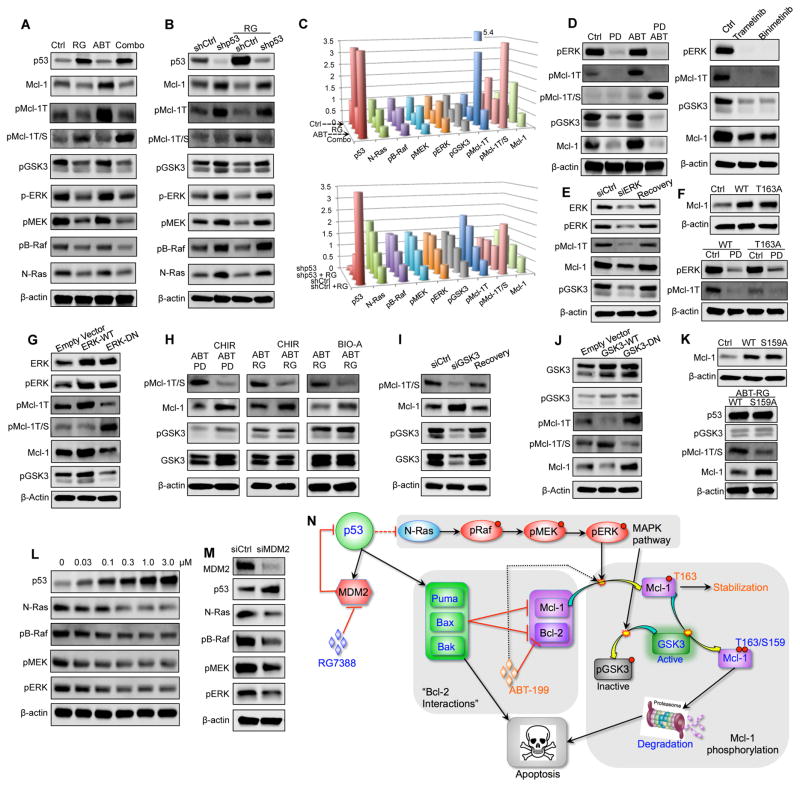
Figure 5. p53 Regulates MAPK/GSK3 Signaling to Modulate Mcl-1 Phosphorylation and Degradation.
(A) Immunoblots of the indicated proteins in OCI-AML3 cells treated with DMSO control, 1 μM RG, 1 μM ABT, or the combination for 24 hr.
(B) Immunoblots of the indicated proteins in control and p53 knockdown OCI-AML3 cells after treatment with vehicle DMSO or 1 μM RG for 24 hr.
(C) Three-dimensional cylinder charts showing protein levels in panels A (top) and B (bottom) as measured by quantitative immunoblot using the Odyssey Infrared Imaging System. Value = 1 for untreated control.
(D) Immunoblots of the indicated proteins in OCI-AML3 cells treated with DMSO control, 1 μM ABT, 100 nM PD0325901 (PD), or both compounds for 12 hr.
(E) Immunoblots of pMcl-1T and pGSK3 after transient ERK knockdown in OCI-AML3 cells.
(F) Immunoblot of Mcl-1 in control OCI-AML3 cells or OCI-AML3 cells overexpressing the wild-type or the T163A mutant Mcl-1 (upper) or immunoblots of pERK and pMcl-1T in Mcl-1WT and Mcl-1T163A overexpressing OCI-AML3 cells treated with 100 nM PD for 12 hr (lower).
(G) Immunoblots of the indicated proteins in OCI-AML3 cells overexpressing wild-type ERK or dominant-negative (DN) ERK.
(H) Immunoblots of the indicated proteins in OCI-AML3 cells treated with different combinations of 1 μM ABT, 100 nM PD, 1 μM RG, and GSK3 inhibitors CHIR-99021 (CHIR, 1 μM) or BIO-Acetoxime (BIO-A, 1 μM) for 24 hr.
(I) Immunoblots of the indicated proteins after transient GSK3 knockdown in OCI-AML3 cells. Cells were treated with both 1 μM ABT and 1 μM RG for 24 hr before immunoblotting.
(J) Immunoblots of the indicated proteins in OCI-AML3 cells stably overexpressing wild-type or dominant-negative (DN) GSK3. Cells were treated with ABT/RG (1 μM each) for 24 hr.
(K) Immunoblot of Mcl-1 in control MV-4-11 cells or MV-4-11 cells overexpressing the wild-type or S159A mutant Mcl-1 (upper) or immunoblots of the indicated proteins in Mcl-1WT and Mcl-1S159A overexpressing MV-4-11 cells after treatment with 1 μM ABT and 1 μM RG for 24 hr.
(L) Immunoblots of the indicated proteins in OCI-AML3 cells after treatment with escalating doses of RG for 24 hr.
(M) Immunoblots of the indicated proteins in control and MDM2 knockdown OCI-AML3 cells.
(N) Schematic of the proposed mechanism by which p53 activation overcomes Mcl-1–mediated resistance. See also Figure S4.

