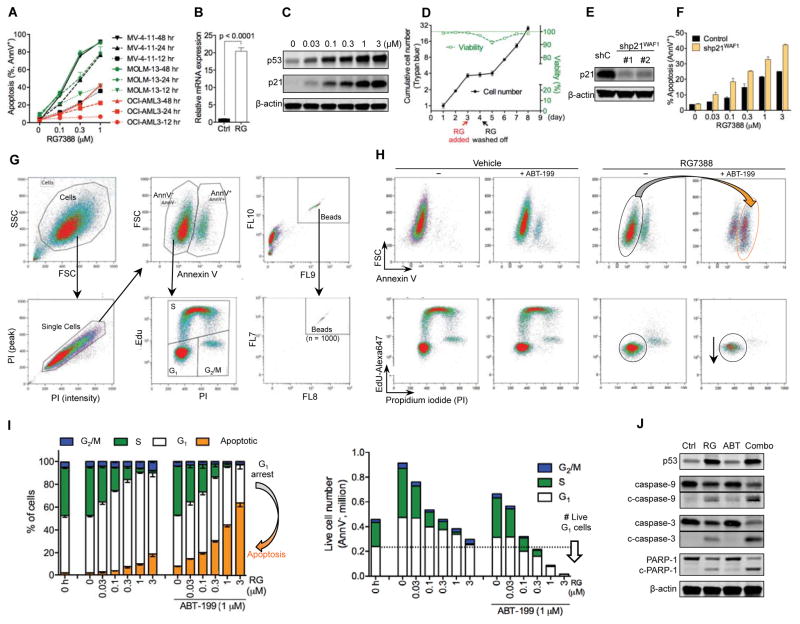
Figure 6. Bcl-2 Inhibition Reciprocally Overcomes Resistance to p53 Activation by Shifting Cellular Response from G1 Arrest to Apoptosis.
(A) Apoptosis percentage of MV-4-11, MOLM-13, and OCI-AML3 cells after treatment with indicated concentrations of RG for 12, 24, or 48 h.
(B) Relative mRNA expression of CDKN1A (p21-encoding gene) in OCI-AML3 cells after 12 hr treatment with 1 μM RG.
(C) Immunoblots of p53 and p21 in OCI-AML3 cells after 24 hr treatment with indicated concentrations of RG.
(D) The cell numbers and viability of OCI-AML3 cells treated with 1 μM RG as indicated. Cells were analyzed with Vi-CELL viability analyzer (Trypan blue exclusion assay).
(E) Immunoblots showing stable p21 knockdown in OCI-AML3 cells. Due to the low basal expression of p21, the control (shC) or knockdown cells were treated with 1 μM RG for 12 hr to induce p21 prior to immunoblot analysis.
(F) Apoptosis of the control and p21 knockdown OCI-AML3 cells after 48 hr treatment with indicated concentrations of RG.
(G) Flow cytometry plots showing the gating strategy to simultaneously analyze apoptosis and cell cycle distribution. The absolute cell numbers were enumerated using CountBright counting beads.
(H) Representative flow cytometry plots of OCI-AML3 cells after 24 hr treatment. The gating strategy was the same as in (G).
(I) Apoptosis and cell cycle analysis of OCI-AML3 cells treated with RG in the absence or presence of ABT for 24 hr. The gating strategy was the same as in (G).
(J) Cleavage of caspase-3, -9 and PARP-1 in response to 24 hr treatment with DMSO (vehicle), 1 μM RG, 1 μM ABT, or the ABT/RG combination. c-, cleaved.
Data in the line/bar graphs (A, B, D, F, I) represent the means of triplicate experiments. Error bars, mean ± SD. See also Figure S5.

