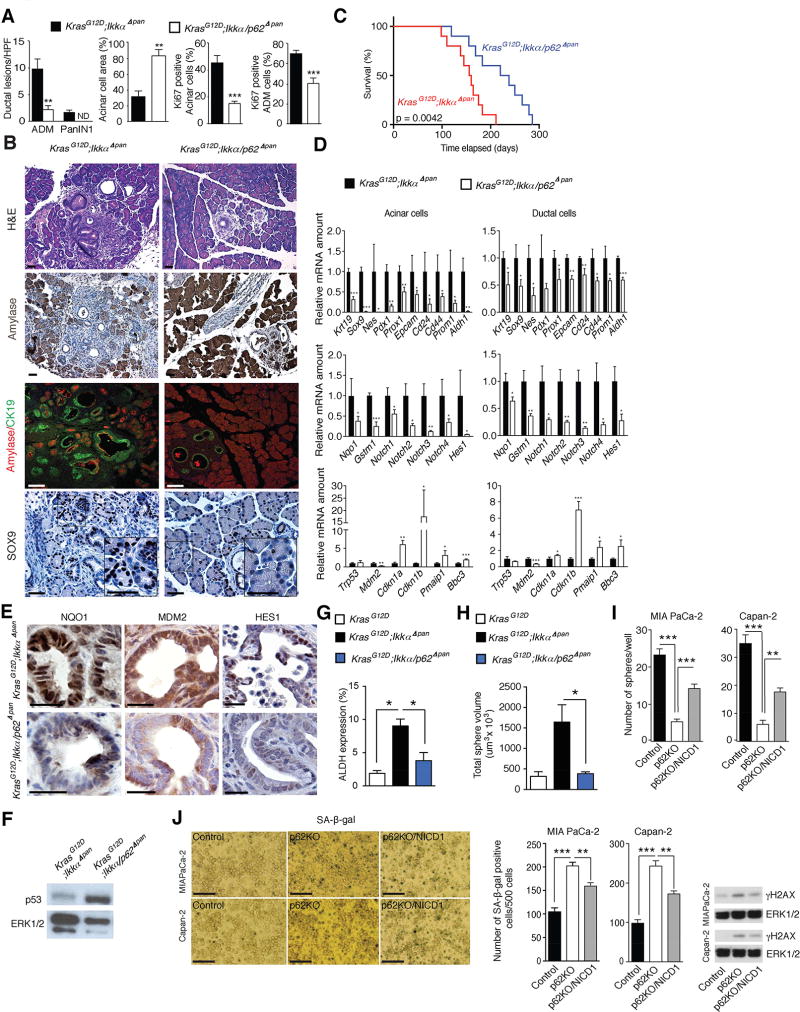
Figure 3. p62 Ablation Attenuates Pancreatitis-Accelerated Neoplastic Progression.
(A) Quantification of ADM and PanIN1 density, amylase and Ki67 staining of pancreatic sections of indicated 5-week-old mice (n = 5). (B) H&E staining, amylase IHC, amylase and CK19 co-IF, and Sox9 IHC of pancreatic sections from indicated 5-week-old mice. Scale bars: 25 µm. (C) Kaplan-Meier survival curves of indicated mouse strains (n = 10). (D) Q-RT-PCR analysis of mRNA in acinar and ductal cell fractions from indicated 5-week-old mice (n = 5). (E) NQO1, MDM2 and HES1 IHC of pancreatic sections from indicated 5-week-old mice. Scale bars: 25 µm. (F) p53 IB analysis of pancreatic lysates from 5-week-old mice of indicated genotypes. (G) Frequency of ALDH expression in EpCAM+ cells from 8-week-old KrasG12D (n = 3), KrasG12D;IkkαΔpan (n = 7), and KrasG12D;Ikkα/p62Δpan (n = 4) mice. (H) Sphere-forming capacity of isolated ALDH+ cells from indicated genotypes (n = 3 per group). (I) Sphere formation of control and p62-ablated MIA PaCa-2 and Capan-2 cells with or without NICD1 overexpression. (J) Representative images and quantified SA-β-gal staining and γ-H2AX and ERK1/2 IB of cells as in I. Scale bars: 100 µm. Results in A, D, and G–J are mean ± SEM; *, p < 0.05; **, p < 0.01; ***, p < 0.001. Statistical significance was calculated using Student’s t test (A, D, G–J) or log-rank test (C). See also Figure S3.

