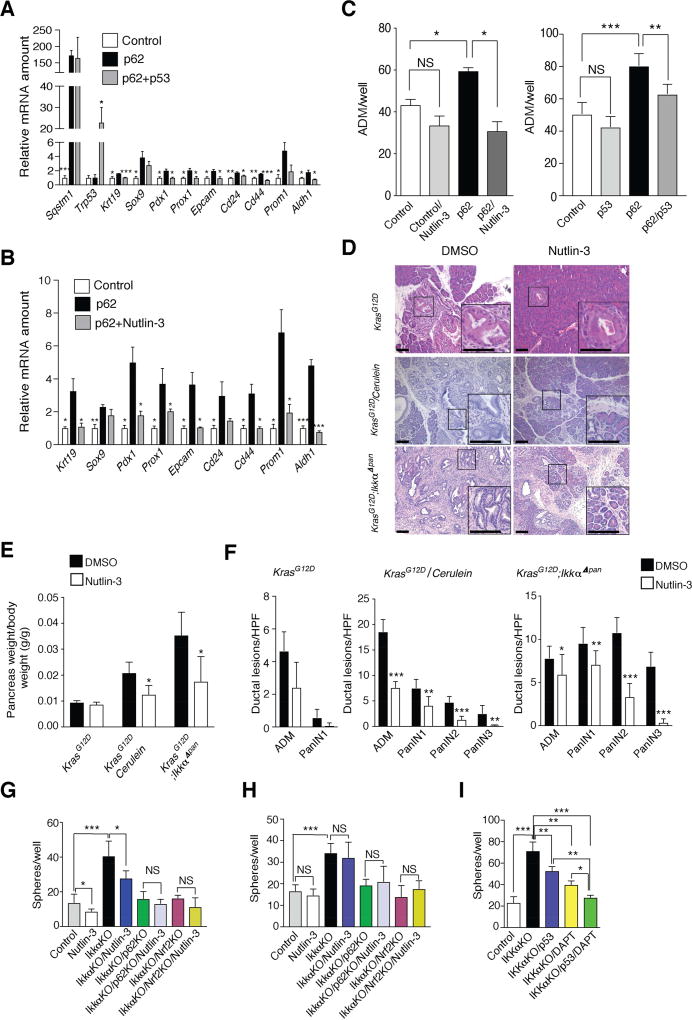
Figure 6. p53 inhibits p62 Induction of Stem/Progenitor Marker Genes.
(A, B) Q-RT-PCR mRNA analysis primary KrasG12D acinar cells transfected with control or p62 expression vectors with or without p53 (A) or with or without Nutlin-3 (10 µM) treatment (B) (n = 3 each panel). (C) Quantification of duct-like structures formed by KrasG12D primary acinar cells transfected with either empty or p62 and/or p53 expression vectors and cultured for 4 days in Matrigel with or without Nutlin-3 (n = 3). (D) H&E stained pancreatic sections from mice of indicated genotypes treated with DMSO or Nutlin-3 for 21 days (KrasG12D and cerulein-treated KrasG12D) or 14 days (KrasG12D;IkkαΔpan) (n = 7). (E, F) Pancreata of 5-week-old KrasG12D and KrasG12D;IkkαΔpan mice (n = 7 each group), treated as indicated. Pancreas weight (E) and ADM and PanIN lesions (F). (G, H) Sphere formation by Nutlin-3 (10 µM) or DMSO-treated control or Ikkα-ablated KC (G) and KPC (H) cells with or without p62 or NRF2 ablation. (I) Sphere formation of control or IKKα-ablated Capan-2 human PDAC cells with or without p53 overexpression and/or DAPT treatment (10 µM). Results in A–C, E–I are mean ± SEM; *, p < 0.05; **, p < 0.01; ***, p < 0.001 by Student’s t test. See also Figure S6.

