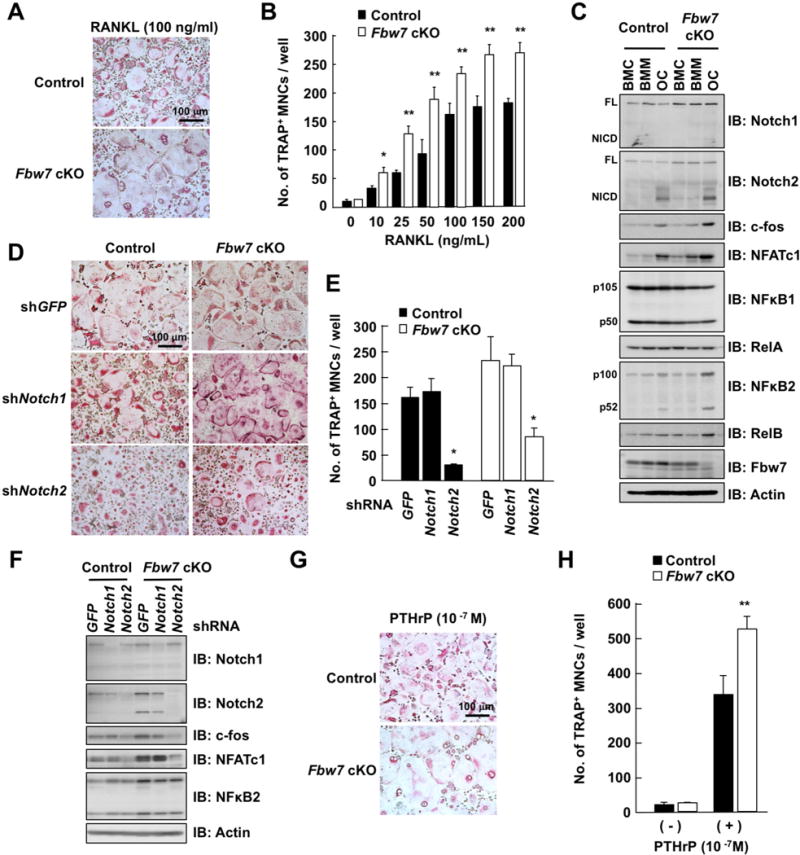
Figure 6. Fbw7-depleted osteoclast precursors display elevated capacity of osteoclast differentiation.

A. BMCs derived from Fbw7 cKO or control mice were cultured in the presence of M-CSF (50 ng/mL) for 3 days. The culture of differentiated bone marrow macrophages (BMM) was treated with 100 ng/mL RANKL for 3 days for differentiation into osteoclasts (OC). Cells were fixed and stained for TRAP, and TRAP-positive MNCs were counted. Scale bar: 100 μm.
B. BMM in (A) were treated with increasing concentration of RANKL for 3 days for differentiation to osteoclasts. Cells were fixed and stained for TRAP, and TRAP-positive MNCs were counted. Data represents mean ± SD. The presented data was obtained from three animals (n = 3) of each genotype, and plotted the average of three animal data with six-sample number per mouse, *p < 0.05, **p < 0.01, Student’s t test.
C. IB analysis of WCL derived from BMC, BMM, and OC cultured in (A).
D. Microscopic view of osteoclasts. Mouse BMCs were cultured in the presence of M-CSF (50 ng/mL) for 3 days. Cells were infected with shRNA lentiviral vectors specific for GFP, Notch1, or Notch2. The infected cells were cultured with RANKL (50 ng/mL) for 3 days for differentiation into osteoclasts. Cells were fixed and stained for TRAP. Scale bar: 100 μm.
E. Osteoclasts cultured in (D) were fixed and stained for TRAP, and the TRAP-positive MNCs were counted. Data represent mean ± SD, n = 3, *p < 0.05, Student’s t test.
F. IB analysis of WCL derived from osteoclasts cultured in (D).
G. Representative microscopic view of osteoclast formation in co-culture of BMM and osteoblasts in the presence of PTHrP (10−7 M). MNCs were fixed and stained for TRAP. Scale bar: 100 μm.
H. TRAP-positive MNCs were counted. Data represents mean ± SD, n = 3, **p < 0.01, Student’s t test.
See also Figure S6
