. 2017 Dec 12;6:e29353. doi: 10.7554/eLife.29353

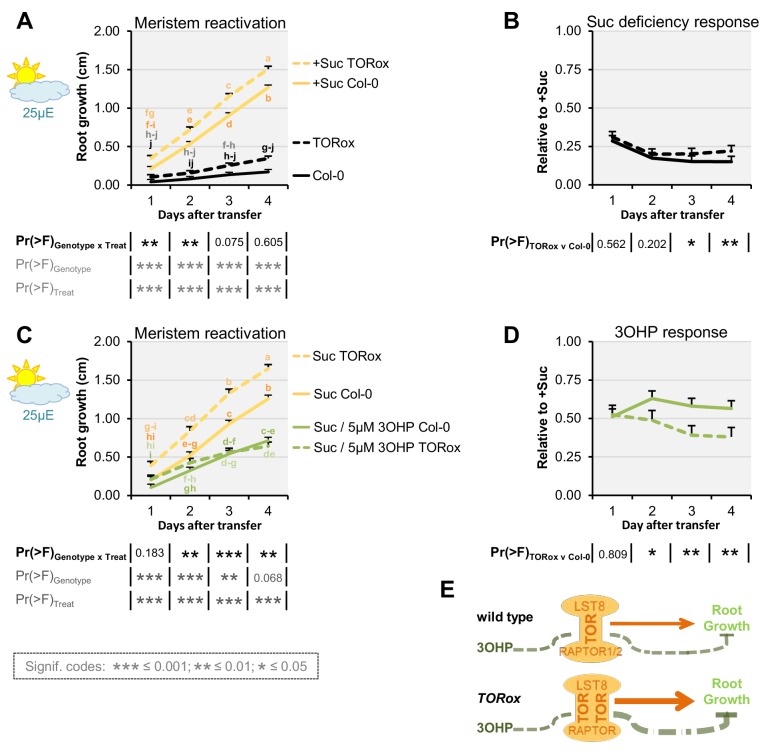
Figure 5. TOR over-activation amplifies 3OHP response.

(A) Root growth for low light grown seedlings. The seedlings were grown on MS medium without sucrose for 3 days, then transferred to the indicated media (Suc; sucrose). Multi-factorial ANOVA was used to test the impact of Genotype (Col-0 v TORox), Treatment (Control v Sucrose) and their interaction on root length. All experiments were combined in the model and experiment treated as a random effect. The ANOVA results from each day are presented in the table. (B) The root lengths grown photo-constrained and without sucrose (from A) displayed at each time point as relative to the respective sucrose activated roots. Results least squared means ± SE over three independent experimental replicates with each experiment having an average of nine replicates per condition (n = 26–30). Multi-factorial ANOVA was used to test the impact of Genotype (Col-0 v TORox), Treatment (Sucrose v Sucrose/3OHP) and their interaction on root length. All experiments were combined in the model and experiment treated as a random effect. The ANOVA results from each day are presented in the table. (C) Root growth for low light grown seedlings. The seedlings were grown on MS medium without sucrose for 3 days, then transferred to the indicated media. (D) Photo-constrained root lengths in response to sucrose and 3OHP (from A) displayed at each time point as relative to the respective sucrose activated roots. Results are least squared means ± SE over two independent experimental replicates with each experiment having an average of six replicates per condition (n = 11–14). (E) Schematic model; over expression of the catalytic subunit TOR increases growth and the relative 3OHP response.

Figure 5.

Figure 5—figure supplement 1. Published TORox lines that did not display the TORox phenotype under our conditions.
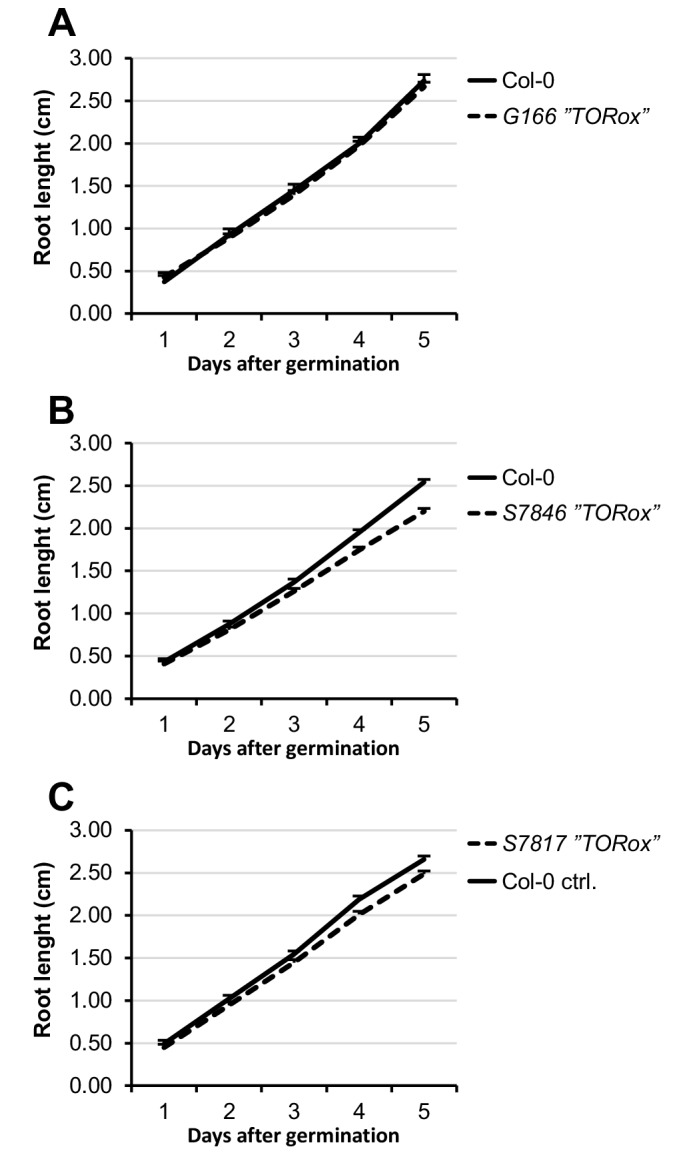
Figure 5—figure supplement 1.

Multi-factorial ANOVA was used to test the impact of Genotype (Col-0 v specific TORox lines) on root length. All experiments were combined in the model and experiment treated as a random effect. There were no significant differences found. (A) Root growth for the published TORox line G166 and wildtype Col-0 seedlings grown on MS medium supplemented with or without 5 µM 3OHP.Results are least squared means ± SE (n = 8–16). (B) Root growth for the published TORox line S7846 and wildtype Col-0 seedlings grown on MS medium supplemented with or without 5 µM 3OHP. Results are least squared means ± SE ns across three biological repeats (n = 35–45). (C) Root growth for the published TORox line S7817 and wildtype Col-0 seedlings grown on MS medium supplemented with or without 5 µM 3OHP Results are least squared means ± SE (n = 10–24).
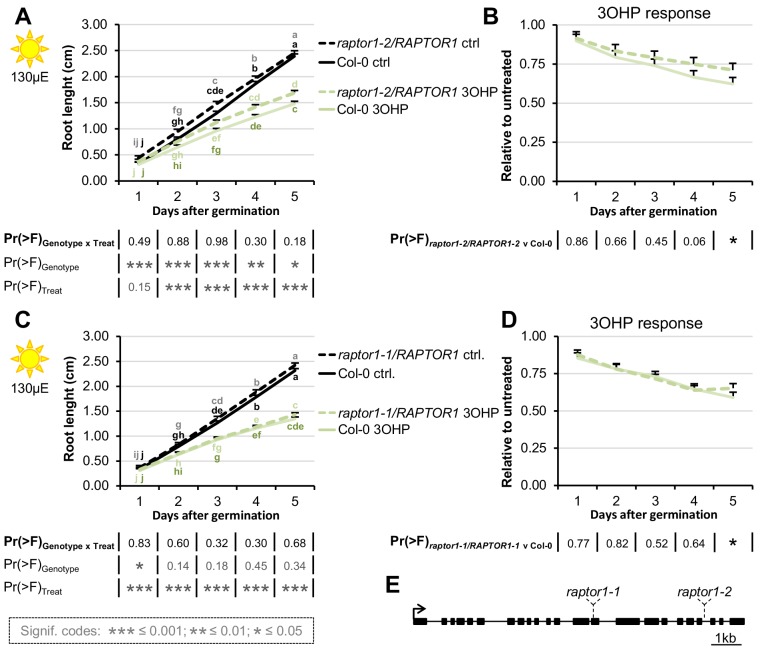
Figure 5—figure supplement 2. RAPTOR1 haplo-insufficiency does not affect 3OHP response.

Figure 5—figure supplement 2.

(A) Root growth for heterozygous raptor1-2 and wildtype Col-0 seedlings grown on MS medium supplemented with or without 5 µM 3OHP. Multi-factorial ANOVA was used to test the impact of Genotype (Col-0 v raptor1-2), Treatment (Control v 3OHP) and their interaction on root length. All experiments were combined in the model and experiment treated as a random effect. The ANOVA results from each day are presented in the table. (B) Root lengths in response to 3OHP (from A) displayed at each time point as relative to untreated. Results are least squared means ± SE over three independent experimental replicates with each experiment having an average of six replicates per condition (n = 16–19). (C) Root growth for heterozygous raptor1-2 and wildtype Col-0 seedlings grown on MS medium supplemented with or without 5 µM 3OHP. Multi-factorial ANOVA was used to test the impact of Genotype (Col-0 v raptor1-1), Treatment (Control v 3OHP) and their interaction on root length. All experiments were combined in the model and experiment treated as a random effect. The ANOVA results from each day are presented in the table. (D) Root lengths in response to 3OHP (from C) displayed at each time point as relative to untreated. Results are least squared means ± SE over three independent experimental replicates with each experiment having an average of seven replicates per condition (n = 16–24). (E) Gene structure and T-DNA insertion sites for RAPTOR1.
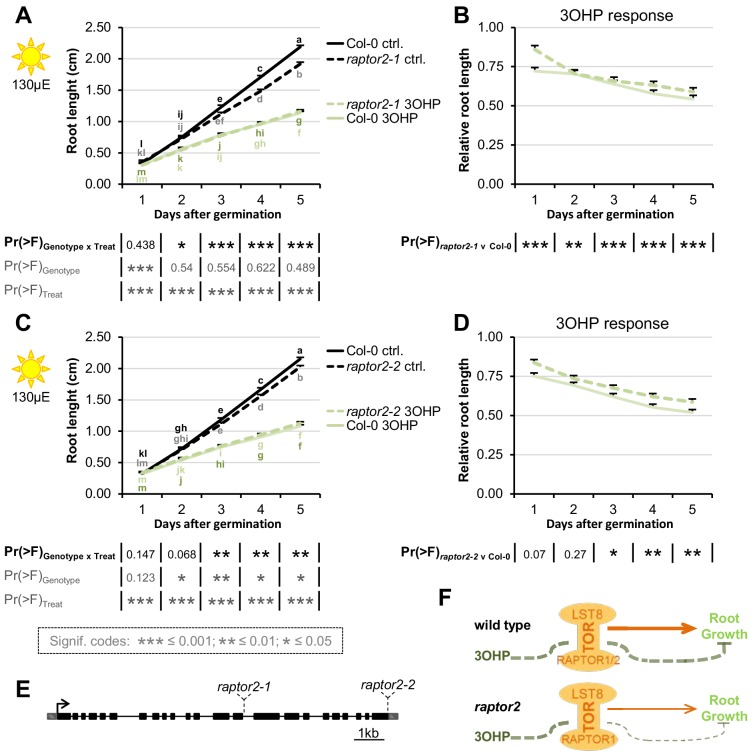
Figure 5—figure supplement 3. Loss of one of the two substrate-binding TORC-subunits affect 3OHP response.

Figure 5—figure supplement 3.

(A) Root growth for raptor2-1 and wildtype Col-0 seedlings grown on MS medium supplemented with or without 5 µM 3OHP. Multi-factorial ANOVA was used to test the impact of Genotype (Col-0 v raptor2-1), Treatment (Control v 3OHP) and their interaction on root length. All experiments were combined in the model and experiment treated as a random effect. The ANOVA results from each day are presented in the table. (B) Root lengths in response to 3OHP (from A) displayed at each time point as relative to untreated. Results are least squared means ± SE over four independent experimental replicates with each experiment having an average of thirteen replicates per condition (n = 36–68). (C) Root growth for raptor2-2 and wildtype Col-0 seedlings grown on MS medium supplemented with or without 5 µM 3OHP. Multi-factorial ANOVA was used to test the impact of Genotype (Col-0 v raptor2-1), Treatment (Control v 3OHP) and their interaction on root length. All experiments were combined in the model and experiment treated as a random effect. The ANOVA results from each day are presented in the table. (D) Root lengths in response to 3OHP (from C) displayed at each time point as relative to untreated. Results are least squared means ± SE over three independent experimental replicates with each experiment having an average of nineteen replicates per condition (n = 44–70). (E) Gene structure and T-DNA insertion sites for RAPTOR2. (F) Schematic model; loss of one of the substrate-binding subunits RAPTOR2 decreases growth, and the relative 3OHP response.