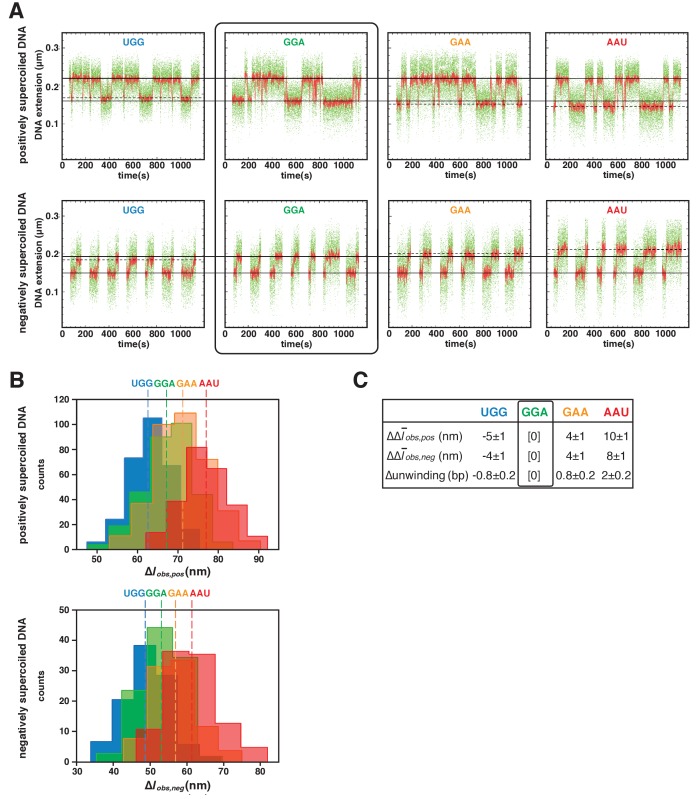
Figure 4. TSS selection downstream and upstream of the modal TSS involves, respectively: increases and decreases in RNAP-dependent DNA unwinding.
(A) Use of single-molecule DNA nanomanipulation to define RNAP-dependent DNA unwinding. Single-molecule time traces with primers UGG, GGA, GAA, and AAU (positively supercoiled DNA in upper panel; negatively supercoiled DNA in lower panel). Rectangle with rounded corners highlights case of primer GGA, which programs TSS selection at position 7. Colors as in Figure 2B. (B) Transition-amplitude histograms (positively supercoiled DNA in upper panel; negatively supercoiled DNA in lower panel). (C) Differences in Δobs,pos, Δobs,neg, and DNA unwinding (bottom panel) with primers UGG, GGA, GAA, and AAU (means ± SEM).


