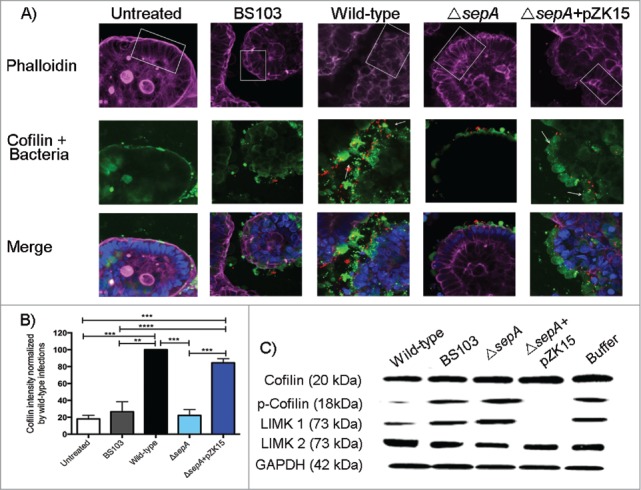
Figure 2.

SepA regulates proteins involved in actin dynamics. (A) Z-section confocal microscopy (20X magnification) of the SMI-100 3D intestinal model after apical infection with the following S. flexneri strains: wild-type, BS103, ΔsepA, ΔsepA+pZK15, and mock-treated. The top panel shows the F-actin architecture (phalloidin in purple) of the SMI-100; white squares highlight sections showing where the differences in the columnar architecture of the epithelium are more noticeable after infection. The middle panel shows bacteria (in red) and cofilin expression (in green) on infected SMI-100; white arrows point at desquamated cells at the apical pole of the epithelium exhibiting high cofilin expression. The bottom panel shows the merged figures with the cell nuclei (in blue). (B) Intensity of cofilin expression after infection of the SMI-100 with the S. flexneri strains described above was estimated using Photoshop CS4. Values are expressed as percent of cofilin intensity compared with intensity in cells infected with wild-type S. flexneri. Values represent the mean ± SEM of 3 separate experiments. (C) Western blot analysis of coflin, p-cofilin, LIMK1 and LIMK2 expression on epithelial cell monolayers apically-infected with S. flexneri strains.
