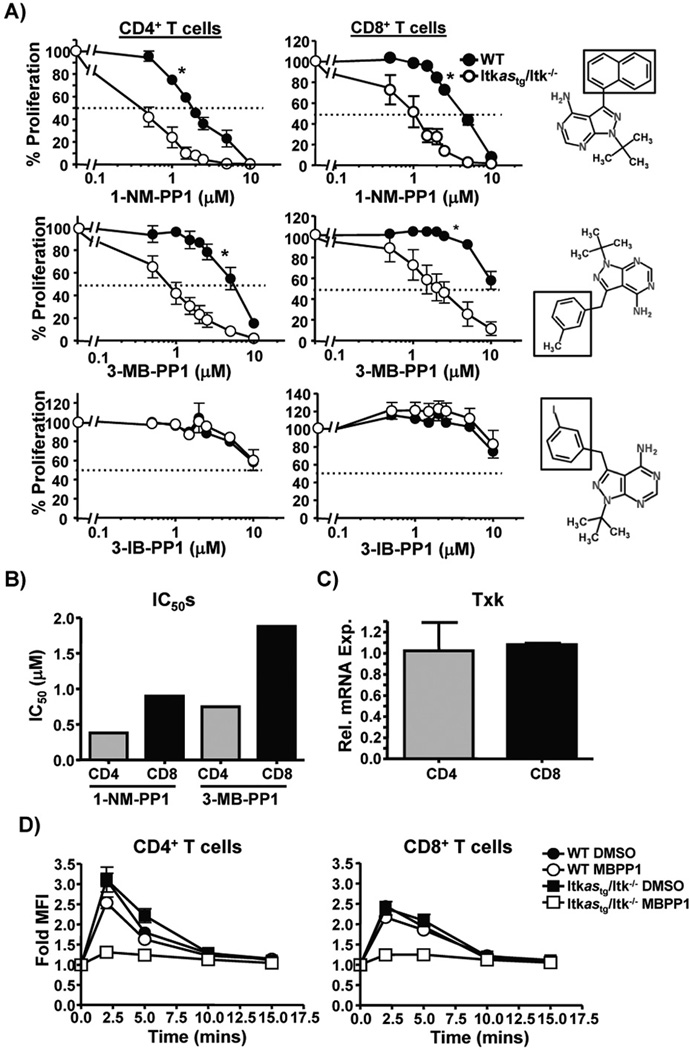
Figure 5. TCR induced proliferation of CD4+ and CD8+ T cells show differential sensitivity to inhibition of Itk.
Splenocytes from Tg(CD2-hItkas)Itk−/− mice were loaded with CFSE and stimulated with α-CD3/CD28 for 72 hrs in the presence of varying concentrations of (A) 1-NM-PP1 (Top), 3-MB-PP1 (middle) or 3-IB-BPP1 (bottom) and CFSE dilution of CD4+TCRβ+ and CD8+TCRβ+ cells determined. Percent inhibition of proliferation was calculated by normalizing to respective vehicle control. Values are means ± SEMs of n≥3, representative of at-least 3 independent experiments, *p < .05 by 2-way ANOVA. B) IC50 values for inhibition of proliferation of CD4+ and CD8+ T cells by 1-NM-PP1 and 3-MB-PP1 determined from the data shown in (A). C) Quantification of Txk mRNA in purified CD4+ and CD8+ T cells from Tg(CD2-hItkas)Itk−/− mice, expression level in CD4+ T cells set as 1, values are means ± SEMs of n=3. D) Splenocytes from Tg(CD2-hItkas)Itk−/− mice were stimulated with anti-CD3 and crosslinking antibody, and CD4 and CD8 T cells analyzed for phospho-ERK by flow cytometry. Fold change in MFI is plotted with non-stimulated cells set as 1. Values are means ± SEMs, of 2 experiments.

