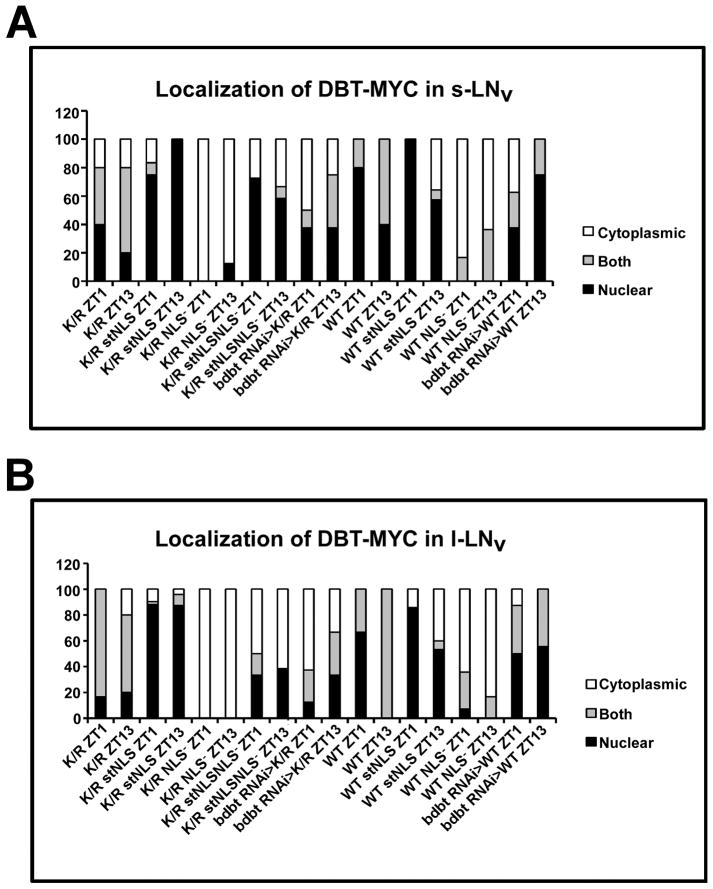
Figure 3.
Quantification of DBT-MYC localization in s-LNv cells (A) and l-LNvs (B). Images were scored blind to the identity of the samples and the time of collection for localization of DBT. PDF was used as a marker for cytoplasmic localization. Brain hemispheres showing DBT signal that was all through most of the PDF+ s-LNv or l-LNv were scored as “both.” Brain hemispheres with DBT signal that colocalized only with PDF in most s-LNv or l-LNv or was not visible were scored as cytoplasmic, while those in which the signal did not colocalize with PDF and was concentrated centrally were scored as nuclear. The width of the differently shaded bars is proportional to the percentage of brains with the indicated score.

