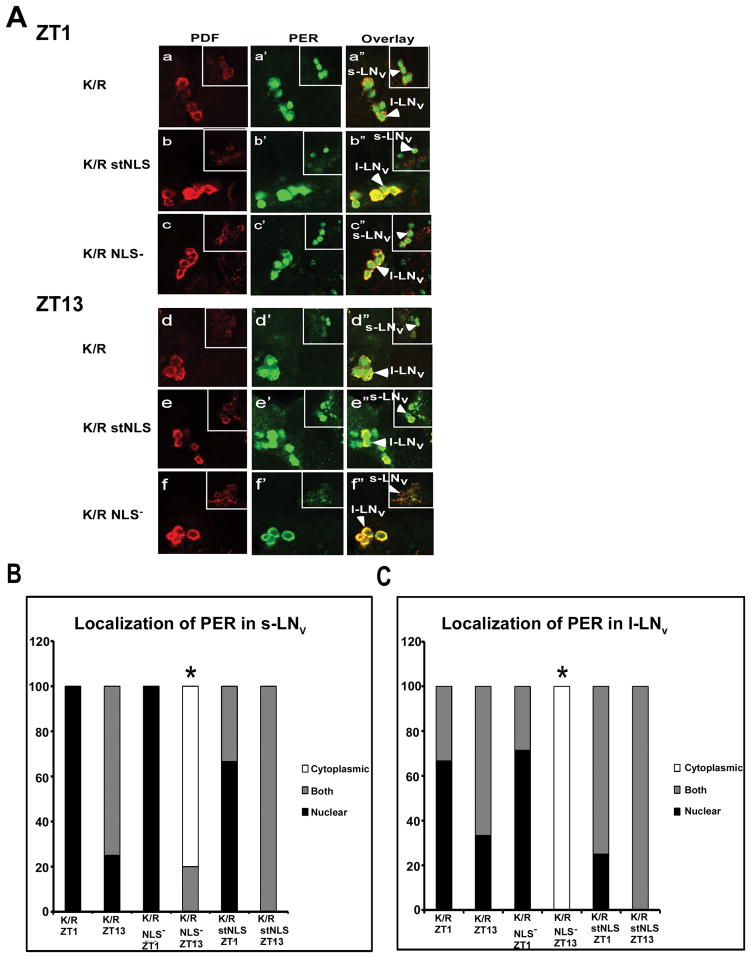
Figure 6.
Confocal images of adult brain hemisphere show damped oscillations for PER subcellular localization in dbtK/R and dbtK/R stNLS flies, but robust oscillations in dbtK/R NLS− flies. (A) Brains were collected from the indicated genotypes at ZT1 and ZT13, and both PER (green) and PDF (red) were detected with antibodies as indicated in Materials and Methods. Small lateral neurons (s-LNV) and large lateral neurons (L-LNv) were imaged in separate optical sections in which the most neurons of each type could be visualized and are presented separately for each image, with s-LNvs in the smaller window. dbtK/R flies exhibit high levels of PER localized to nuclei or to both nuclei and cytosol at both ZT1 (a-a″) and ZT13 (d-d″). dbtK/R stNLS flies also exhibit high levels of PER localized to nuclei or to both nuclei and cytosol at both ZT1 (b-b″) and ZT13 (e-e″). dbtK/R NLS− flies exhibit robust rhythms of PER subcellular localization, with mostly nuclear PER at ZT1 (c-c″) and cytosolic or no PER detection at ZT13 (f-f″). Quantification of PER localization in PDF+ s-LNvs (B) and l-LNvs (C). Images were scored blinded to sample identity and time for localization of PER. PDF was used as a marker for cytoplasmic localization. Brain hemispheres with PDF+ s-LNV or l-LNv cells that showed PER signal throughout the cell were scored as both. Brain hemispheres with PDF+ s-LNv or l-LNv cells that showed PER signal colocalized only with PDF or no PER detection were scored as cytoplasmic, and brain hemispheres with PDF+ s-LNv or l-LNv cells showing PER signal that did not colocalize with PDF and was centrally located were scored as nuclear. * PER localization scores in dbtK/R NLS− mutant flies at ZT13 in the s-LNv or l- LNv differed significantly from PER localization in dbtK/RNLS− flies at ZT1 (P<0.01), by Kruskal-Wallis nonparametric H ANOVA (H (11, N= 67) =51.7), with a multiple comparisons of mean ranks for all groups.

