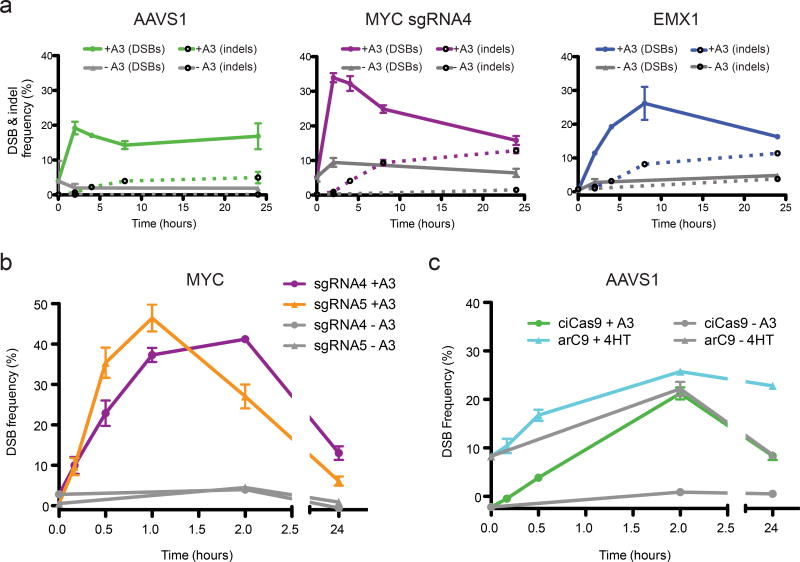
Figure 3. Investigation of DSB and indel kinetics with ciCas9 and DSB-ddPCR.
(a) Time courses of the frequency of DSBs and indels at three loci following activation of ciCas9 are shown. Solid lines indicate DSB frequency, dashed lines indicate indel frequency. DSBs were quantified using DSB-ddPCR and indels were quantified by high-throughput sequencing. Error bars depict s.e.m. (n = 3 cell culture replicates). (b) A DSB time course focused on the first two hours following ciCas9 activation is shown for two sgRNAs targeting the MYC locus. Error bars depict s.e.m. (n = 3 cell culture replicates). (c) A DSB time course comparing ciCas9 to a 4-hydroxytamoxifen-activated Cas9 variant, arC9, is shown. Error bars depict s.e.m. (n = 3 cell culture replicates).

