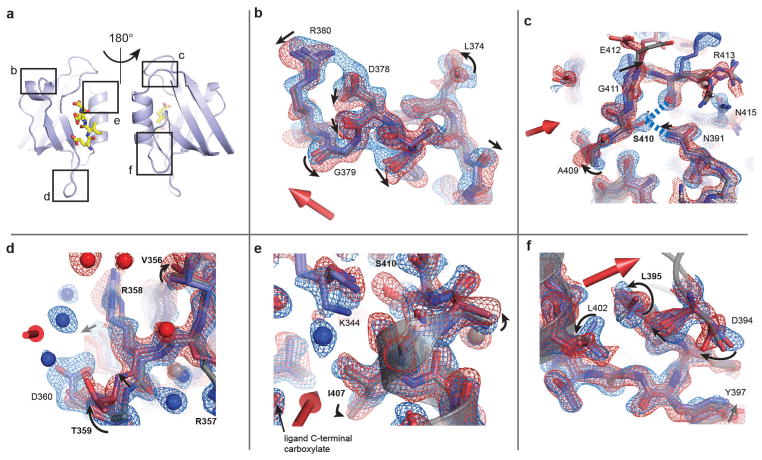
Extended Data Figure 6. Additional views of conformational changes due to the electric field.
a, Reference model indicating regions examined in b–f. b–f, Maps and models as in Fig. 4, with motions indicated by arrows and residues coupled to ligand binding in PDZ domains shown (as in Supplementary Table 1). b, Top view of the α1 helix, waters omitted and the side chain of Q377 truncated for clarity. c, Transverse shift of the α2–β6 loop, and perturbed down state of S410, forming new hydrogen bonds to R413 and N391 (dashed blue lines). d, Upward motion of the β2–β3 loop and change in dynamic disorder of protein and solvent. e, Conformational changes at the top of the ligand-binding pocket, with motion of the terminal amine of the K344 towards the ligand carboxylate group in the down state. f, Coupled rotameric changes of L402 (α2 helix), L395 and D394.

