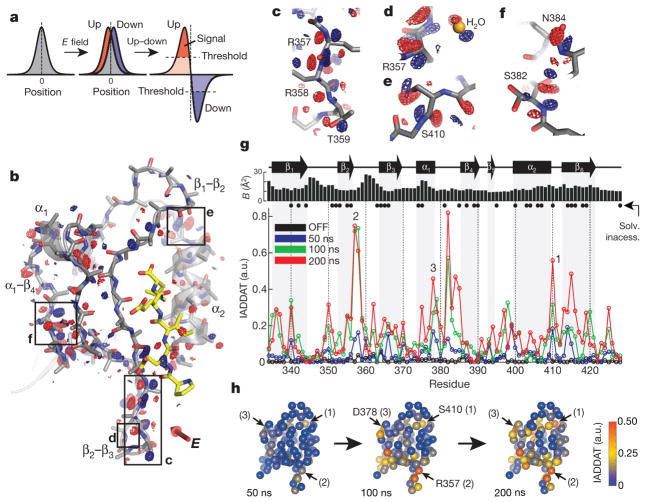
Figure 3. The up–down internal difference analysis.
a, In the simplest case, the electric field will shift the electron density distribution for an atom in the up and down molecules (red and blue, respectively) in opposite directions around its centroid in the voltage-OFF molecule (grey) (left and middle). Subtracting the up and down densities and applying a noise threshold (right), we expect peaks of positive (red) and negative (blue) difference density surrounding an atom in the OFF state—the hallmark of an electric-field-induced motion. b, The up–down internal difference map for a ‘front’ view of LNX2PDZ2, with regions highlighted in c–f boxed. The red three-dimensional arrow indicates the direction of the electric field, and bound ligand is in yellow. Maps are contoured at + 3.5 (red) and − 3.5 (blue) σOFF and, for clarity, are displayed within a 1.8 Å shell around main chain + Cβ atoms (see PyMOL session S1 for full map). c–f, Examples of electric-field-induced motions—opposing red and blue density—for main-chain, side-chain and solvent atoms. g, The IADDAT for the up–down molecules as a function of LNX2PDZ2 primary structure and time (blue, green and red traces). The OFF difference density (black) indicates the noise in the analysis. The graphs above indicate buried residues (solvent accessibility < 0.15 (Solv. inaccess.)) and refined isotropic B-factor for the voltage-OFF model. a.u., arbitrary units. h, The time evolution of the electric-field-induced effects mapped on the tertiary structure of LNX2PDZ2. Spheres indicate Cα positions and colours IADDAT.

