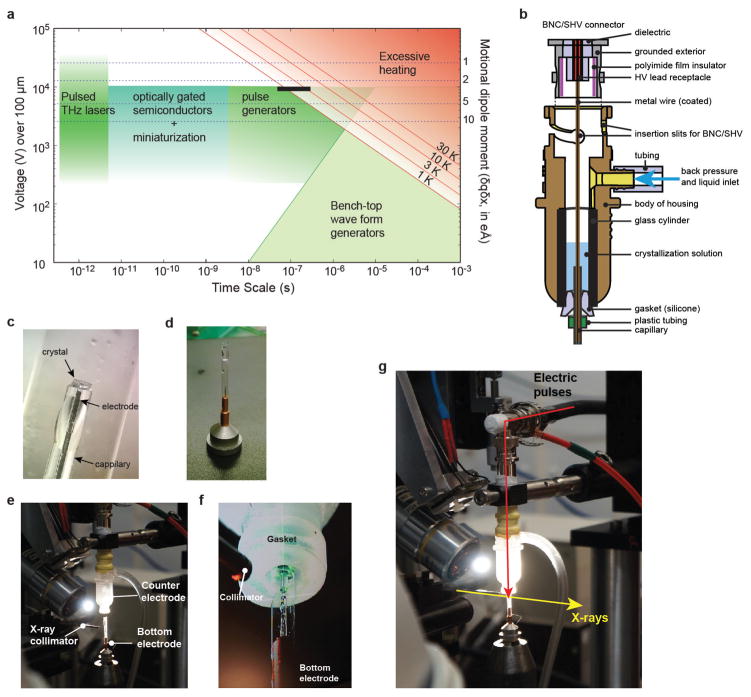
Extended Data Figure 1. The experimental setup of EF-X.
a, A plot relating the applied voltage across a 100-μm-thick crystal (left axis) and the size of transition dipole moments of conformational changes that can be excited by 1kBT (right axis) to the duration of the applied electric field. Feasible methods of generating strong electric field pulses are indicated as green and cyan shaded areas. Waveform and pulse generators can provide pulses down to the nanosecond timescale. Faster pulses can be generated using terahertz pulsed lasers with strong electric field components51 or by optical gating of semiconductors52; such systems are already present at third-generation synchrotron and X-ray free-electron laser facilities. The black bar indicates the approximate range covered by the current experiments. The calculation of temperature jumps caused by the electric field is described in Supplementary Information IA. b, Schematic cross-section of the counter electrode. The blue arrow indicates the path by which backpressure is applied to drive flow through the capillary (see Methods). c, Crystals are mounted on top of capillaries containing a metal electrode and soaked in crystallization solution. d, The capillary with crystal is mounted in a reusable goniometer base and protected from humidity fluctuations with a polyester sleeve (MiTeGen) containing 50% (v/v) crystallization solution. This assembly forms the bottom electrode. e, The counter and bottom electrodes are assembled at the beam line to allow rotation around the capillary axis. f, Once the sleeve is trimmed to just above the level of the crystal, the counter electrode is brought in using a translation stage (camera view of the approach) (Supplementary Video 2). g, Overview of the final set up with the direction of the X-ray and electric field pulses, reproduced from Fig. 1e.

