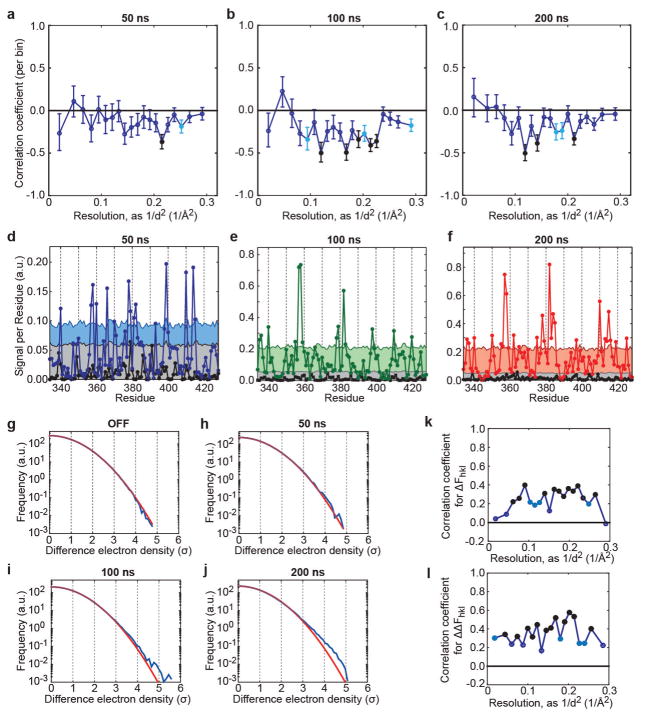
Extended Data Figure 4. Validation of signal in structure factors and difference maps.
a–c, A negative correlation between and is consistent with oppositely directed motions in the up and down states. Analysis is performed over 20 resolution bins to allow for statistical testing. Shown are the correlation coefficients per bin between ΔFhkl and ΔFh̄kl̄. In a linear response approximation and in the absence of measurement error, we expect ΔFhkl=−ΔFh̄kl̄. Reflections with |ΔFhkl| < σ(ΔFhkl), |ΔFh̄kl̄| < σ(ΔFh̄kl̄) or |ΔFhkl| > 10 were excluded from analysis, and likewise for ΔFh̄kl̄. Results at 50 ns (a), 100 ns (b) and 200 ns (c). To assess significance, each bin was considered statistically homogeneous, with observations considered independent. Bins with significant negative deviation from 0 (after Fisher Z-transform) are indicated as filled circles (P < 10−3: black; P < 10−2: light blue). Error bars indicate standard errors based on the assumption of a normal distribution after Fisher Z-transform. d–f, Statistical significance of Fig. 3g. Comparison of integrated absolute difference density above 2.5σ, within 1.5 Å of backbone C, N and O atoms (‘signal’; see also Fig. 3a). d, Comparison of signal in the OFF state and at 50 ns. The grey-shaded area indicates the 0–95th percentile for random sampling from the OFF map at the same probe volume (because the conformation of the backbone changes from residue to residue, the effective probe volume varies along the protein backbone) and threshold. The blue-shaded area indicates the 0–95th percentile for random sampling using the conservative sampling protocol described in test 4 of the statistical validation. e, Same analysis at 100 ns. f, Same analysis at 200 ns. Note that we were unable to scale all diffraction images at once, and instead scaled the OFF data with each time point separately. We compare each ON data set to the OFF data as scaled with that time point. As a result, there are small differences between the OFF traces in d–f. g–j, Deviations from a normal distribution for internal difference maps. Shown are voxel histograms for internal difference electron density (DED) maps without applied field (OFF) (g), and at 50 ns (h), 100 ns (i) and 200 ns (j) of applied electric field. Red lines indicate fits to a normal distribution based on calculated variance. Blue lines are histograms of voxel internal DED values (map grids of 0.3 Å). Note that by construction, for internal DED maps the positive and negative sides of the histogram are the same, apart from discretization effects. To assess statistical significance of deviations from normality, we sampled C2 asymmetric units (ASUs) at the Nyquist sampling frequency (here, 0.9 Å). For the OFF map, we find no significant deviations from normality (P > 0.1 for the Jarque–Bera test, the Anderson–Darling test, and the Lilliefors test; all using default settings in Matlab). At 200 ns, each test rejects a normal distribution with P < 0.01. At 50 and 100 ns, the results of statistical testing depend on how the internal DED map is subsampled: for a single C2 ASU, none of the tests rejects the null hypothesis, but when the same number of points is sampled from two neighbouring ASUs, the Jarque–Bera test rejects normality (P < 0.01 at 50 and 100 ns), suggesting limited deviation from normality. k, l, Reproducibility of a structural response to electric field. Correlation of data set 2 (see Supplementary Table 7) to the data set presented in the text. On the basis of ordinary differences ΔFhkl (k) and internal differences (l), reflections with |ΔFhkl| < σ(ΔFhkl)|, |ΔFh̄kl̄| < σ(ΔFh̄kl̄), or |ΔFhkl| > 10 were excluded from analysis, and likewise for ΔFh̄kl̄. The standard error of correlation coefficient estimates is ~ 0.07 in k and ~ 0.10 in l. Each bin is statistically homogeneous and observations are considered independent. Resolution bins with significant positive deviation from 0 (after Fisher Z-transform) are indicated as filled circles (P < 10−3: black; P < 10−2: light blue).

