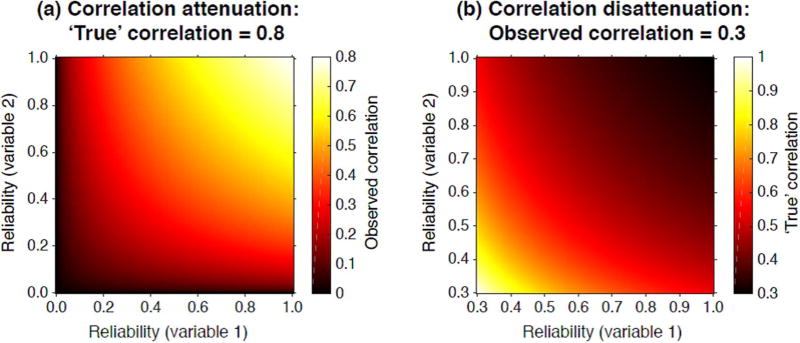
Fig. 2.
Panel (a) shows the attenuation of a ‘true’ correlation (the correlation between hypothetical ‘universe scores’) of 0.8 between two variables, as a function of the test-retest reliabilities of each of the two variables. Panel (b) shows the converse: the disattenuated ‘true’ correlation between two variables given an observed correlation of 0.3, as a function of the test-retest reliabilities of each of the two variables.

